
STATISTICS F/BUSINESS+ECONOMICS-TEXT
13th Edition
ISBN: 9781305881884
Author: Anderson
Publisher: CENGAGE L
expand_more
expand_more
format_list_bulleted
Videos
Textbook Question
Chapter 13.5, Problem 32E
As part of a study designed to compare hybrid and similarly equipped conventional vehicles. Consumer Reports tested a variety of classes of hybrid and all-gas model cars and sport utility vehicles (SUVs). The following data show the miles-per-gallon rating Consumer Reports obtained for two hybrid small cars, two hybrid midsize cars, two hybrid small SUVs, and two hybrid midsize SUVs: also shown are the miles per gallon obtained for eight similarly equipped conventional models.
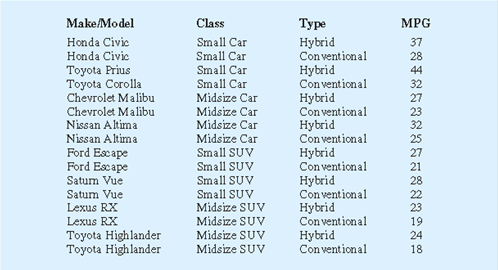
At the α = .05 level of significance, test for significant effects due to class, type, and interaction.
Expert Solution & Answer

Trending nowThis is a popular solution!

Students have asked these similar questions
Examine the Variables: Carefully review and note the names of all variables in the dataset. Examples of these variables include:
Mileage (mpg)
Number of Cylinders (cyl)
Displacement (disp)
Horsepower (hp)
Research: Google to understand these variables.
Statistical Analysis: Select mpg variable, and perform the following statistical tests. Once you are done with these tests using mpg variable, repeat the same with hp
Mean
Median
First Quartile (Q1)
Second Quartile (Q2)
Third Quartile (Q3)
Fourth Quartile (Q4)
10th Percentile
70th Percentile
Skewness
Kurtosis
Document Your Results:
In RStudio: Before running each statistical test, provide a heading in the format shown at the bottom. “# Mean of mileage – Your name’s command”
In Microsoft Word: Once you've completed all tests, take a screenshot of your results in RStudio and paste it into a Microsoft Word document. Make sure that snapshots are very clear. You will need multiple snapshots. Also transfer these results to the…
2 (VaR and ES) Suppose X1
are independent. Prove that
~
Unif[-0.5, 0.5] and X2
VaRa (X1X2) < VaRa(X1) + VaRa (X2).
~
Unif[-0.5, 0.5]
8 (Correlation and Diversification)
Assume we have two stocks, A and B, show that a particular combination
of the two stocks produce a risk-free portfolio when the correlation between
the return of A and B is -1.
Chapter 13 Solutions
STATISTICS F/BUSINESS+ECONOMICS-TEXT
Ch. 13.2 - The following data are from a completely...Ch. 13.2 - In a completely randomized design, seven...Ch. 13.2 - Refer to exercise 2. a. what hypotheses are...Ch. 13.2 - In an experiment designed to test the output...Ch. 13.2 - In a completely randomized design, 12 experimental...Ch. 13.2 - Develop the analysis of variance computations for...Ch. 13.2 - Three different methods for assembling a product...Ch. 13.2 - Refer to the NCP data in Table 13.4. Set up the...Ch. 13.2 - To study the effect of temperature on yield in a...Ch. 13.2 - Auditors must make judgments about various aspects...
Ch. 13.2 - Four different paints are advertised as having the...Ch. 13.2 - The Consumer Reports Restaurant Customer...Ch. 13.3 - The following data arc from a completely...Ch. 13.3 - The following data are from a completely...Ch. 13.3 - To test whether the mean time needed to mix a...Ch. 13.3 - Refer to exercise 15. Use Fishers LSD procedure to...Ch. 13.3 - The following data are from an experiment designed...Ch. 13.3 - To lest for any significant difference in the...Ch. 13.3 - Refer to exercise 18. Use the Bonferroni...Ch. 13.3 - The International League of Triple-A minor league...Ch. 13.4 - Consider the experimental results for the...Ch. 13.4 - The following data were obtained for a randomized...Ch. 13.4 - An experiment has been conducted for four...Ch. 13.4 - An automobile dealer conducted a test to determine...Ch. 13.4 - The price drivers pay for gasoline often varies a...Ch. 13.4 - The Scholastic Aptitude Test (SAT) contains three...Ch. 13.4 - A study reported in the Journal of the American...Ch. 13.5 - A factorial experiment involving two levels of...Ch. 13.5 - The calculations for a factorial experiment...Ch. 13.5 - A mail-order catalog firm designed a factorial...Ch. 13.5 - An amusement park studied methods for decreasing...Ch. 13.5 - As part of a study designed to compare hybrid and...Ch. 13.5 - A study reported in The Accounting Review examined...Ch. 13 - In a completely randomized experimental design,...Ch. 13 - A study reported in the Journal of Small Business...Ch. 13 - The U.S. Environmental Protection Agency (EPA)...Ch. 13 - The following data show the percentage of 17- to...Ch. 13 - Prob. 38SECh. 13 - In a study conducted to investigate browsing...Ch. 13 - A research firm tests the miles-per-gallon...Ch. 13 - The compact car market in the United States is...Ch. 13 - Prob. 42SECh. 13 - A factorial experiment was designed to test for...Ch. 13 - A manufacturing company designed a factorial...Ch. 13 - Wentworth Medical Center As part of a long-term...Ch. 13 - Compensation for Sales Professionals Suppose that...
Knowledge Booster


Learn more about
Need a deep-dive on the concept behind this application? Look no further. Learn more about this topic, statistics and related others by exploring similar questions and additional content below.Similar questions
- 9 (Portfolio allocation) Suppose R₁ and R2 are returns of 2 assets and with expected return and variance respectively r₁ and 72 and variance-covariance σ2, 0%½ and σ12. Find −∞ ≤ w ≤ ∞ such that the portfolio wR₁ + (1 - w) R₂ has the smallest risk.arrow_forward7 (Multivariate random variable) Suppose X, €1, €2, €3 are IID N(0, 1) and Y2 Y₁ = 0.2 0.8X + €1, Y₂ = 0.3 +0.7X+ €2, Y3 = 0.2 + 0.9X + €3. = (In models like this, X is called the common factors of Y₁, Y₂, Y3.) Y = (Y1, Y2, Y3). (a) Find E(Y) and cov(Y). (b) What can you observe from cov(Y). Writearrow_forward1 (VaR and ES) Suppose X ~ f(x) with 1+x, if 0> x > −1 f(x) = 1−x if 1 x > 0 Find VaRo.05 (X) and ES0.05 (X).arrow_forward
- Joy is making Christmas gifts. She has 6 1/12 feet of yarn and will need 4 1/4 to complete our project. How much yarn will she have left over compute this solution in two different ways arrow_forwardSolve for X. Explain each step. 2^2x • 2^-4=8arrow_forwardOne hundred people were surveyed, and one question pertained to their educational background. The results of this question and their genders are given in the following table. Female (F) Male (F′) Total College degree (D) 30 20 50 No college degree (D′) 30 20 50 Total 60 40 100 If a person is selected at random from those surveyed, find the probability of each of the following events.1. The person is female or has a college degree. Answer: equation editor Equation Editor 2. The person is male or does not have a college degree. Answer: equation editor Equation Editor 3. The person is female or does not have a college degree.arrow_forward
- At the same restaurant as in Question 19 with the same normal distribution, what's the chance of it taking no more than 15 minutes to get service?arrow_forwardClint, obviously not in college, sleeps an average of 8 hours per night with a standard deviation of 15 minutes. What's the chance of him sleeping between 7.5 and 8.5 hours on any given night? 0-(7-0) 200 91109s and doiw $20 (8-0) mol 8520 slang $199 galbrog seam side pide & D (newid se od poyesvig as PELEO PER AFTE editiw noudab temand van Czarrow_forwardTimes to complete a statistics exam have a normal distribution with a mean of 40 minutes and standard deviation of 6 minutes. Deshawn's time comes in at the 90th percentile. What percentage of the students are still working on their exams when Deshawn leaves?arrow_forward
arrow_back_ios
SEE MORE QUESTIONS
arrow_forward_ios
Recommended textbooks for you
 Glencoe Algebra 1, Student Edition, 9780079039897...AlgebraISBN:9780079039897Author:CarterPublisher:McGraw Hill
 Big Ideas Math A Bridge To Success Algebra 1: Stu...AlgebraISBN:9781680331141Author:HOUGHTON MIFFLIN HARCOURTPublisher:Houghton Mifflin Harcourt
 Functions and Change: A Modeling Approach to Coll...AlgebraISBN:9781337111348Author:Bruce Crauder, Benny Evans, Alan NoellPublisher:Cengage Learning
Glencoe Algebra 1, Student Edition, 9780079039897...
Algebra
ISBN:9780079039897
Author:Carter
Publisher:McGraw Hill
Big Ideas Math A Bridge To Success Algebra 1: Stu...
Algebra
ISBN:9781680331141
Author:HOUGHTON MIFFLIN HARCOURT
Publisher:Houghton Mifflin Harcourt
Functions and Change: A Modeling Approach to Coll...
Algebra
ISBN:9781337111348
Author:Bruce Crauder, Benny Evans, Alan Noell
Publisher:Cengage Learning
Introduction to experimental design and analysis of variance (ANOVA); Author: Dr. Bharatendra Rai;https://www.youtube.com/watch?v=vSFo1MwLoxU;License: Standard YouTube License, CC-BY