
Concept explainers
Videos
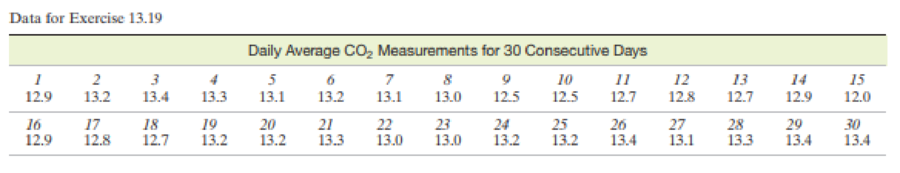
Detecting under-reported emissions. The Environmental Protection Agency EPA) regulates the level of carbon dioxide (CO2) emissions. Periodically these emissions measurements are under-reported due to leakage or faulty equipment. Such problems are often detected only by an expensive test (RATA) that is typically conducted only once per year. Just recently, the EPA began applying an automated control chart methodology to detect under- measurement of emissions data (EFRI CEM Users Group Conference. Nashville. ”N. May 13. 2008). Each day. the EPA collects emissions data by measuring CO2 concentration for each of 6 randomly selected hours. The daily average CO2 levels for each of 30 days are shown in the table at the bottom of the page. The EPA considers these values to truly represent emissions eves because the RATA test was recently performed and showed no problems with under-reporting. The lower and upper control limits for the averages were established as LCL = 12.26 and UCL = 13.76.
- a. Construct a control chart for the daily average CO2 levels.
- b. Based on the control chart, describe the behavior of the measurement process.
- c. The following average CO2 levels were determined for a later 10-day period: 12.7, 12.1, 12.0, 12.0, 11.8, 11.7, 11.6, 11.7, 11.6, 11 7. Make an inference about the potential under-reporting of the emissions data for this 10-day period.
Want to see the full answer?
Check out a sample textbook solution
Chapter 13 Solutions
EP STATISTICS F/BUS.+ECON.-ACCESS 18 WK


- Not use ai pleasearrow_forwardHelp me write these economic analysis for Macys one paragraph) Company name/current state of operation of this company - Describe the company's performance in the present economy, whether it is growing or declining, and who are its competitors?arrow_forwardnot use ai pleasearrow_forward
- The following graph plots daily cost curves for a firm operating in the competitive market for sweatbands. Hint: Once you have positioned the rectangle on the graph, select a point to observe its coordinates. Profit or Loss0246810121416182050454035302520151050PRICE (Dollars per sweatband)QUANTITY (Thousands of sweatbands per day)MCATCAVC8, 30 In the short run, given a market price equal to $15 per sweatband, the firm should produce a daily quantity of sweatbands. On the preceding graph, use the blue rectangle (circle symbols) to fill in the area that represents profit or loss of the firm given the market price of $15 and the quantity of production from your previous answer. Note: In the following question, enter a positive number regardless of whether the firm earns a profit or incurs a loss. The rectangular area represents a short-run of thousand per day for the firm.arrow_forwardNot use ai pleasearrow_forwardSouth Africa faces the triple challenge of poverty, inequality and unemployment and the national minimum wage debate has pulled on all three threads to make arguments for and against this policy. Discuss the theoretical implications of a national minimum wage, and touching on each of the three challenges South Africa faces, discuss some arguments for how this policy may affect them.arrow_forward
 Managerial Economics: Applications, Strategies an...EconomicsISBN:9781305506381Author:James R. McGuigan, R. Charles Moyer, Frederick H.deB. HarrisPublisher:Cengage Learning

 Managerial Economics: A Problem Solving ApproachEconomicsISBN:9781337106665Author:Luke M. Froeb, Brian T. McCann, Michael R. Ward, Mike ShorPublisher:Cengage Learning
 Microeconomics: Principles & PolicyEconomicsISBN:9781337794992Author:William J. Baumol, Alan S. Blinder, John L. SolowPublisher:Cengage Learning
 Principles of Economics 2eEconomicsISBN:9781947172364Author:Steven A. Greenlaw; David ShapiroPublisher:OpenStax