Mathematical Excursions (MindTap Course List)
4th Edition
ISBN: 9781305965584
Author: Richard N. Aufmann, Joanne Lockwood, Richard D. Nation, Daniel K. Clegg
Publisher: Cengage Learning
expand_more
expand_more
format_list_bulleted
Concept explainers
Videos
Textbook Question
Chapter 13.1, Problem 39ES
Consider the data in the following table.
Summary of Yards Gained in Two Foothill Games
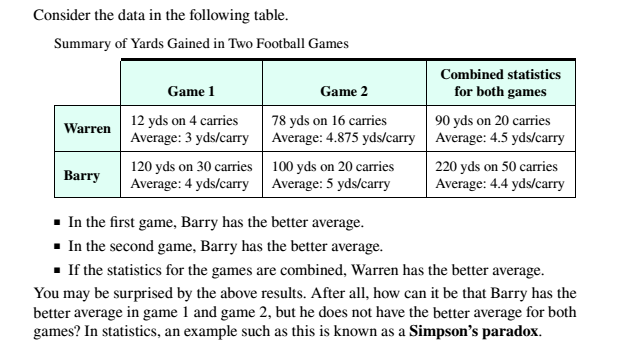
• In the first game. Barry has the better average.
• In the second game. Barry has the better average.
• If the statistics for the games are combined. Warren has the better average. You may be surprised by the above results. After all, how can it be that Barry has the better average in game 1 and game 2, but he does not have the better average for both games? In statistics, an example such as this is known as a Simpson’s paradox.
Form groups of three or four students to work Exercises 39.
Consider the following data.
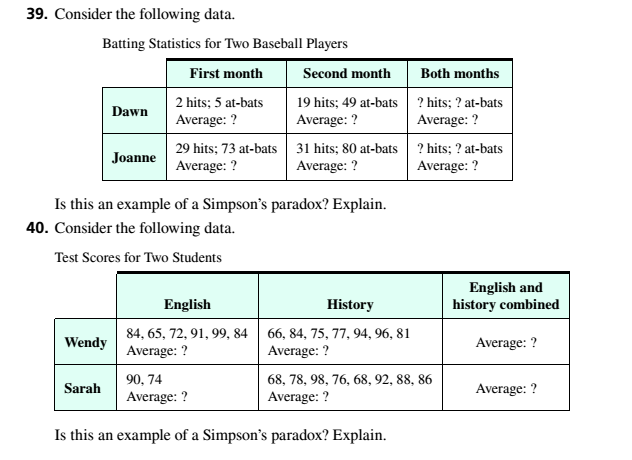
Is this an example of a Simpson’s paradox? Explain.
Expert Solution & Answer
Want to see the full answer?
Check out a sample textbook solution
Students have asked these similar questions
3. Suppose that f(z) = x² − y² −2y+i (2x-2xy), where z = x+iy. Use the expressions
(see Sec. 6)
x =
z┼え
2
Z
-
Z
and
y =
2i
to write f(z) in terms of z, and simplify the result.
Ans. f(z)²+2iz.
2
Suppose that you flip a coin four times,
and it comes up heads each time. Does this
outcome give you reason to believe that the
coin isn't legitimate?
dedo
Raupnu stens
My be
sunildes ad
ndaniver uoy no grin
PALO STO 2010 COMO IT COU
10. Prove that a finite set of points
Z1, Z2,
Zn cannot have any accumulation points.
Chapter 13 Solutions
Mathematical Excursions (MindTap Course List)
Ch. 13.1 - Use linear interpolation to find the number that...Ch. 13.1 - Use linear interpolation to find the number that...Ch. 13.1 - A calculator shows that 21.414 and 31.732. Use...Ch. 13.1 - We know that 21=2 and 22=4 . Use linear...Ch. 13.1 - At the present time, a football player weighs 325...Ch. 13.1 - Find the mean, median, and mode(s), if any, for...Ch. 13.1 - Find the mean, median, and mode(s), if any, for...Ch. 13.1 - Find the mean, median, and mode(s), if any, for...Ch. 13.1 - Find the mean, median, and mode(s), if any, for...Ch. 13.1 - Find the mean, median, and mode(s), if any, for...
Ch. 13.1 - Find the mean, median, and mode(s), if any, for...Ch. 13.1 - Find the mean, median, and mode(s), if any, for...Ch. 13.1 - Find the mean, median, and mode(s), if any, for...Ch. 13.1 - Find the mean, median, and mode(s), if any, for...Ch. 13.1 - Find the mean, median, and mode(s), if any, for...Ch. 13.1 - a. If exactly one number in a set of data is...Ch. 13.1 - If a t of data has a mode, then must the mode be...Ch. 13.1 - Academy Awards The following table displays the...Ch. 13.1 - Academy Awards The following table displays the...Ch. 13.1 - Dental Schools Dental schools provide urban...Ch. 13.1 - Expense Reports A salesperson records the...Ch. 13.1 - Use the above grading system to find each students...Ch. 13.1 - Use the above grading system to find each students...Ch. 13.1 - Use the above grading system to find each students...Ch. 13.1 - Use the above grading system to find each students...Ch. 13.1 - Calculate a Course Grade A professor grades...Ch. 13.1 - Calculate a Course Grade A professor grades...Ch. 13.1 - Baseball In baseball, a batters slugging average,...Ch. 13.1 - Baseball In baseball, a batters slugging average,...Ch. 13.1 - Baseball In baseball, a batters slugging average,...Ch. 13.1 - Baseball In baseball, a batters slugging average,...Ch. 13.1 - Find the mean, the median, and all modes for the...Ch. 13.1 - Find the mean, the median, and all modes for the...Ch. 13.1 - Find the mean, the median, and all modes for the...Ch. 13.1 - Find the mean, the median, and all modes for the...Ch. 13.1 - Use the following information about another...Ch. 13.1 - Use the following information about another...Ch. 13.1 - Use the following information about another...Ch. 13.1 - Use the following information about another...Ch. 13.1 - Test Scores After 6 biology tests. Ruben has a...Ch. 13.1 - Test Scores After 4 algebra tests. Alisa has a...Ch. 13.1 - Baseball For the first half of a baseball season,...Ch. 13.1 - Commuting Times Mark averaged 60 mph during the...Ch. 13.1 - Consider the data in the following table. Summary...Ch. 13.1 - Consider the data in the following table. Summary...Ch. 13.2 - This exercise makes use of the geometric procedure...Ch. 13.2 - a. to g. Repeat all of the steps described in...Ch. 13.2 - Meteorology During a 12-hour period on December...Ch. 13.2 - Meteorology During a 2-hour period on January 12....Ch. 13.2 - Find the range, the standard deviation, and the...Ch. 13.2 - Find the range, the standard deviation, and the...Ch. 13.2 - Find the range, the standard deviation, and the...Ch. 13.2 - Find the range, the standard deviation, and the...Ch. 13.2 - Find the range, the standard deviation, and the...Ch. 13.2 - Find the range, the standard deviation, and the...Ch. 13.2 - Find the range, the standard deviation, and the...Ch. 13.2 - Find the range, the standard deviation, and the...Ch. 13.2 - Find the range, the standard deviation, and the...Ch. 13.2 - Find the range, the standard deviation, and the...Ch. 13.2 - Mountain Climbing A mountain climber plans to buy...Ch. 13.2 - Lotteries Which would you expect to be larger: the...Ch. 13.2 - Weights of Students Which would you expect to be...Ch. 13.2 - Evaluate the accuracy of the following statement:...Ch. 13.2 - Fuel Efficiency The fuel efficiency, in miles per...Ch. 13.2 - Waiting Times A customer at a specialty coffee...Ch. 13.2 - Fast-food Calories A survey of 10 fast-food...Ch. 13.2 - Energy Drinks A survey of 16 energy drinks noted...Ch. 13.2 - Weekly Commute Times A survey of 15 large cities...Ch. 13.2 - Biology Some studies show that the mean normal...Ch. 13.2 - Recording Industry The table below shows a random...Ch. 13.2 - Pick 5 numbers and compute the population standard...Ch. 13.2 - Pick 6 numbers and compute the population standard...Ch. 13.2 - a. All of the numbers in a sample are the same...Ch. 13.2 - 27. Under what condition would the variance of a...Ch. 13.3 - The following table lists the ages of customers...Ch. 13.3 - Two groups of people were pan of a test to...Ch. 13.3 - The exercise heart rate, in beats per minute...Ch. 13.3 - Round each z-score to the nearest hundredth. A...Ch. 13.3 - Round each z-score to the nearest hundredth. A...Ch. 13.3 - Round each z-score to the nearest hundredth. A...Ch. 13.3 - Round each z-score to the nearest hundredth. A...Ch. 13.3 - Blood Pressure A blood pressure test was given to...Ch. 13.3 - Fruit Juice A random sample of 1000 oranges showed...Ch. 13.3 - Cholesterol A test involving 380 men ages 20 to 24...Ch. 13.3 - Tire Wear A random sample of 80 tires showed that...Ch. 13.3 - Test Scores Which of the following three test...Ch. 13.3 - Physical Fitness Which of the following Illness...Ch. 13.3 - Reading Test On a reading (est. Shaylens score of...Ch. 13.3 - Placement Exams On a placement examination. Rick...Ch. 13.3 - Test Scores Kevin scored at the 65th percentile on...Ch. 13.3 - 14. Test Scores Rene scored at the 84th percentile...Ch. 13.3 - Median Income In 2015, the median family income in...Ch. 13.3 - Monthly Rents A recent survey by the U.S. Census...Ch. 13.3 - Commute to School A survey was given to 18...Ch. 13.3 - Prescriptions The following table shows the number...Ch. 13.3 - Home Sales The accompanying table shows the median...Ch. 13.3 - The table below shows the heights, in inches. of...Ch. 13.3 - The table below shows the numbers of bushels of...Ch. 13.3 - 22. The blood lead concentrations, in micrograms...Ch. 13.3 - 23. a. The population 3, 4, 9, 14, and 20 has a...Ch. 13.3 - For each of the following, determine whether the...Ch. 13.4 - A professor finds that the grades in a large class...Ch. 13.4 - The results of a statew1e examination of the...Ch. 13.4 - A secondary school system finds that the...Ch. 13.4 - Boys Heights Humans are, on average, taller today...Ch. 13.4 - Biology A biologist measured the lengths of...Ch. 13.4 - Use the Empirical Rule to answer each question. In...Ch. 13.4 - Use the Empirical Rule to answer each question. In...Ch. 13.4 - Use the Empirical Rule to answer each question....Ch. 13.4 - Use the Empirical Rule to answer each question....Ch. 13.4 - Use the Empirical Rule to answer each question....Ch. 13.4 - Use the Empirical Rule to answer each question....Ch. 13.4 - Find the area, to the nearest thousandth, of the...Ch. 13.4 - Find the area, to the nearest thousandth, of the...Ch. 13.4 - Find the area, to the nearest thousandth, of the...Ch. 13.4 - Find the area, to the nearest thousandth, of the...Ch. 13.4 - Find the area, to the nearest thousandth, of the...Ch. 13.4 - Find the area, to the nearest thousandth, of the...Ch. 13.4 - Find the area, to the nearest thousandth, of the...Ch. 13.4 - Find the area, to the nearest thousandth, of the...Ch. 13.4 - Find the area, to the nearest thousandth, of the...Ch. 13.4 - Find the area, to the nearest thousandth, of the...Ch. 13.4 - Find the area, to the nearest thousandth, of the...Ch. 13.4 - Find the area, to the nearest thousandth, of the...Ch. 13.4 - Find the area, to the nearest thousandth, of the...Ch. 13.4 - Find the area, to the nearest thousandth, of the...Ch. 13.4 - Find the area, to the nearest thousandth, of the...Ch. 13.4 - Find the area, to the nearest thousandth, of the...Ch. 13.4 - Find the z-score, to the nearest hundredth, that...Ch. 13.4 - Find the z-score, to the nearest hundredth, that...Ch. 13.4 - Find the z-score, to the nearest hundredth, that...Ch. 13.4 - Find the z-score, to the nearest hundredth, that...Ch. 13.4 - Find the z-score, to the nearest hundredth, that...Ch. 13.4 - Find the z-score, to the nearest hundredth, that...Ch. 13.4 - In Exercises 31 to 40, answer each question. Round...Ch. 13.4 - In Exercises 31 to 40, answer each question. Round...Ch. 13.4 - In Exercises 31 to 40, answer each question. Round...Ch. 13.4 - In Exercises 31 to 40, answer each question. Round...Ch. 13.4 - In Exercises 31 to 40, answer each question. Round...Ch. 13.4 - In Exercises 31 to 40, answer each question. Round...Ch. 13.4 - In Exercises 31 to 40, answer each question. Round...Ch. 13.4 - In Exercises 31 to 40, answer each question. Round...Ch. 13.4 - In Exercises 31 to 40, answer each question. Round...Ch. 13.4 - In Exercises 31 to 40, answer each question. Round...Ch. 13.4 - Heights Consider the data set of the heights of...Ch. 13.4 - Weights Consider the data set of the weights - of...Ch. 13.4 - In Exercises 43 to 49, determine whether the given...Ch. 13.4 - In Exercises 43 to 49, determine whether the given...Ch. 13.4 - In Exercises 43 to 49, determine whether the given...Ch. 13.4 - In Exercises 43 to 49, determine whether the given...Ch. 13.4 - In Exercises 43 to 49, determine whether the given...Ch. 13.4 - In Exercises 43 to 49, determine whether the given...Ch. 13.4 - In Exercises 43 to 49, determine whether the given...Ch. 13.4 - a. Make a sketch of two normal distributions that...Ch. 13.4 - Determine the approximate z-scores for the first...Ch. 13.5 - The following table shows Earths atmospheric...Ch. 13.5 - Which of the scatter diagrams below suggests the...Ch. 13.5 - Which of the scatter diagrams below suggests a. a...Ch. 13.5 - Prob. 3ESCh. 13.5 - Given the bivariate data: a. Draw a scatter...Ch. 13.5 - Find the equation of the least squares line and...Ch. 13.5 - Find the equation of the least squares line and...Ch. 13.5 - Find the equation of the least squares line and...Ch. 13.5 - Find the equation of the least squares line and...Ch. 13.5 - Find the equation of the least squares line and...Ch. 13.5 - Find the equation of the least squares line and...Ch. 13.5 - Use the statistics features of a graphing...Ch. 13.5 - Use the statistics features of a graphing...Ch. 13.5 - Use the statistics features of a graphing...Ch. 13.5 - Use the statistics features of a graphing...Ch. 13.5 - Use the statistics features of a graphing...Ch. 13.5 - Life Expectancy The average remaining life times...Ch. 13.5 - Use the statistics features of a graphing...Ch. 13.5 - Use the statistics features of a graphing...Ch. 13.5 - Tuition The following table shows the average...Ch. 13.5 - ____ Search for bivariate data (in a magazine. in...Ch. 13 - Find the mean, median, mode, range, population...Ch. 13 - A set of data has a mean of 16, a median of 15,...Ch. 13 - Write a set of data with five data values for...Ch. 13 - State whether the mean, Median, or mode is being...Ch. 13 - Bridges The lengths of cantilever bridges in the...Ch. 13 - Average Speed Cleone traveled 45 ml to her sisters...Ch. 13 - Grade Point Average In a 4.0 grading system, each...Ch. 13 - Test Scores A teacher finds that the test scores...Ch. 13 - Airline Industry An airline recorded the times it...Ch. 13 - Ticket Prices The following table gives the...Ch. 13 - Test Scores One student received test ores of 85,...Ch. 13 - A population data set has a mean of 81 and a...Ch. 13 - Cholesterol Levels The cholesterol levels for 10...Ch. 13 - Test Scores The following histogram shows the...Ch. 13 - Teacher Salaries Use the following relative...Ch. 13 - Greenhouse Gas Emissions The table below shows...Ch. 13 - Alternative Fuels Alternative fuel vehicles that...Ch. 13 - Test Scores A professor gave a final examination...Ch. 13 - Waiting Time The amount of time customers spend...Ch. 13 - Pet Food The weights of all the sacks of dog food...Ch. 13 - Telecommunication A telephone manufacturer finds...Ch. 13 - Astronomy The following table gives the distances,...Ch. 13 - Given the bivariate data a. Draw a scatter diagram...Ch. 13 - Physics A student has recorded the data in the...Ch. 13 - 25. ____ Internet A test of an Internet service...Ch. 13 - Blood alcohol content (BAC) is measured in grams...Ch. 13 - Find the mean, median, and mode for the following...Ch. 13 - Grade Point Average Use the 4.0 grading system:...Ch. 13 - Find the range, standard deviation, and variance...Ch. 13 - A sample data set has a mean of x=65 and a...Ch. 13 - Basketball Draw a box-and-whisker plot for the...Ch. 13 - Movie Attendance Use the following relative...Ch. 13 - During I month, an overnight delivery company...Ch. 13 - Box Weights The weights of all the boxes of cake...Ch. 13 - A psychologist wants to determine whether there is...Ch. 13 - Nutrition The following table shows the percent of...
Knowledge Booster


Learn more about
Need a deep-dive on the concept behind this application? Look no further. Learn more about this topic, subject and related others by exploring similar questions and additional content below.Similar questions
- 6. Show that a set S is open if and only if each point in S is an interior point.arrow_forward3 Consider tossing a fair coin 10 times and recording the number of heads that occur. a. How many possible outcomes would occur? b. What would be the probability of each of the outcomes? c. How many of the outcomes would have 1 head? What is the probability of 1 head in 10 flips? how d. How many of the outcomes would have o heads? What is the probability of o heads in 10 flips? e. What's the probability of getting 1 head or less on 10 flips of a fair coin?arrow_forward22 Bob decides that after his heart attack is a good time to get in shape, so he starts exer- cising each day and plans to increase his exercise time as he goes along. Look at the two line graphs shown in the following fig- ures. One is a good representation of his data, and the other should get as much use as Bob's treadmill before his heart attack. Exercise time 40 Line Graph 1 of Exercise Log 35 30- 25 201 20 Exercise time 80 80 60 40- 1 10 20 30 30 40 50 60 Day 170 50 80 Line Graph 2 of Exercise Log 1 10 20 90 100 30 30 40 50 60 70 80 90 100 Day a. Compare the two graphs. Do they repre- sent the same data set, or do they show totally different data sets? b. Assume that both graphs are made from the same data. Which graph is more appropriate and why?arrow_forward
- 8 Suppose that a small town has five people with a rare form of cancer. Does this auto- matically mean a huge problem exists that needs to be addressed?arrow_forward1 M&Ms colors come in the following percent- ages: 13 percent brown, 14 percent yellow, 13 percent red, 24 percent blue, 20 percent orange, and 16 percent green. Reach into a bag of M&Ms without looking. a. What's the chance that you pull out a brown or yellow M&M? b. What's the chance that you won't pull out a blue? swarrow_forward11. Prove or disprove: (a) If is a characteristic function, then so is ²; (b) If is a non-negative characteristic function, then so is √√4.arrow_forward
- 17. [-/1 Points] DETAILS MY NOTES SESSCALCET2 6.2.050. Evaluate the integral. (Remember to use absolute values where appropriate. Use C for the constant of integration.) du 4√3- -4² Need Help? Read It SUBMIT ANSWER 18. [-/1 Points] DETAILS MY NOTES SESSCALCET2 6.2.051. Evaluate the integral. (Use C for the constant of integration.) - 49 dx x² +3 Need Help? Read It Watch It SUBMIT ANSWER 19. [-/1 Points] DETAILS MY NOTES SESSCALCET2 6.2.057. Evaluate the integral. (Remember to use absolute values where appropriate. Use C for the constant of integration.) 25+ x2 dxarrow_forwardLet (5,3,-7) and = (2, -3, -6). = Compute the following: u× u = -4(u xv) ux (-4v) (+v) × v=arrow_forwardLet a = (4, -2, -7) and 6 = (2,5, 3). (ã − ò) × (ã + b) =arrow_forward
- 4. Suppose that P(X = 1) = P(X = -1) = 1/2, that Y = U(-1, 1) and that X and Y are independent. (a) Show, by direct computation, that X + Y = U(-2, 2). (b) Translate the result to a statement about characteristic functions. (c) Which well-known trigonometric formula did you discover?arrow_forward9. The concentration function of a random variable X is defined as Qx(h) = sup P(x ≤ X ≤x+h), h>0. x (a) Show that Qx+b (h) = Qx(h). (b) Is it true that Qx(ah) =aQx(h)? (c) Show that, if X and Y are independent random variables, then Qx+y (h) min{Qx(h). Qy (h)). To put the concept in perspective, if X1, X2, X, are independent, identically distributed random variables, and S₁ = Z=1Xk, then there exists an absolute constant, A, such that A Qs, (h) ≤ √n Some references: [79, 80, 162, 222], and [204], Sect. 1.5.arrow_forward29 Suppose that a mound-shaped data set has a must mean of 10 and standard deviation of 2. a. About what percentage of the data should lie between 6 and 12? b. About what percentage of the data should lie between 4 and 6? c. About what percentage of the data should lie below 4? 91002 175/1 3arrow_forward
arrow_back_ios
SEE MORE QUESTIONS
arrow_forward_ios
Recommended textbooks for you
 Glencoe Algebra 1, Student Edition, 9780079039897...AlgebraISBN:9780079039897Author:CarterPublisher:McGraw Hill
 Holt Mcdougal Larson Pre-algebra: Student Edition...AlgebraISBN:9780547587776Author:HOLT MCDOUGALPublisher:HOLT MCDOUGAL
 Big Ideas Math A Bridge To Success Algebra 1: Stu...AlgebraISBN:9781680331141Author:HOUGHTON MIFFLIN HARCOURTPublisher:Houghton Mifflin Harcourt
 Functions and Change: A Modeling Approach to Coll...AlgebraISBN:9781337111348Author:Bruce Crauder, Benny Evans, Alan NoellPublisher:Cengage Learning
Glencoe Algebra 1, Student Edition, 9780079039897...
Algebra
ISBN:9780079039897
Author:Carter
Publisher:McGraw Hill
Holt Mcdougal Larson Pre-algebra: Student Edition...
Algebra
ISBN:9780547587776
Author:HOLT MCDOUGAL
Publisher:HOLT MCDOUGAL
Big Ideas Math A Bridge To Success Algebra 1: Stu...
Algebra
ISBN:9781680331141
Author:HOUGHTON MIFFLIN HARCOURT
Publisher:Houghton Mifflin Harcourt
Functions and Change: A Modeling Approach to Coll...
Algebra
ISBN:9781337111348
Author:Bruce Crauder, Benny Evans, Alan Noell
Publisher:Cengage Learning
The Shape of Data: Distributions: Crash Course Statistics #7; Author: CrashCourse;https://www.youtube.com/watch?v=bPFNxD3Yg6U;License: Standard YouTube License, CC-BY
Shape, Center, and Spread - Module 20.2 (Part 1); Author: Mrmathblog;https://www.youtube.com/watch?v=COaid7O_Gag;License: Standard YouTube License, CC-BY
Shape, Center and Spread; Author: Emily Murdock;https://www.youtube.com/watch?v=_YyW0DSCzpM;License: Standard Youtube License