Mathematical Excursions (MindTap Course List)
4th Edition
ISBN: 9781305965584
Author: Richard N. Aufmann, Joanne Lockwood, Richard D. Nation, Daniel K. Clegg
Publisher: Cengage Learning
expand_more
expand_more
format_list_bulleted
Concept explainers
Videos
Textbook Question
Chapter 13.1, Problem 28ES
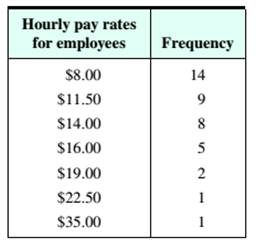
Find the mean, the median, and all modes for the data in the given frequency distribution.
28. Mystic Pizza Company
Expert Solution & Answer

Trending nowThis is a popular solution!

Students have asked these similar questions
answer number 4
3. Bayesian Inference – Updating Beliefs
A medical test for a rare disease has the following characteristics:
Sensitivity (true positive rate): 99%
Specificity (true negative rate): 98%
The disease occurs in 0.5% of the population.
A patient receives a positive test result.
Questions:
a) Define the relevant events and use Bayes’ Theorem to compute the probability that the patient actually has the disease.b) Explain why the result might seem counterintuitive, despite the high sensitivity and specificity.c) Discuss how prior probabilities influence posterior beliefs in Bayesian inference.d) Suppose a second, independent test with the same accuracy is conducted and is also positive. Update the probability that the patient has the disease.
answer number 6
Chapter 13 Solutions
Mathematical Excursions (MindTap Course List)
Ch. 13.1 - Use linear interpolation to find the number that...Ch. 13.1 - Use linear interpolation to find the number that...Ch. 13.1 - A calculator shows that 21.414 and 31.732. Use...Ch. 13.1 - We know that 21=2 and 22=4 . Use linear...Ch. 13.1 - At the present time, a football player weighs 325...Ch. 13.1 - Find the mean, median, and mode(s), if any, for...Ch. 13.1 - Find the mean, median, and mode(s), if any, for...Ch. 13.1 - Find the mean, median, and mode(s), if any, for...Ch. 13.1 - Find the mean, median, and mode(s), if any, for...Ch. 13.1 - Find the mean, median, and mode(s), if any, for...
Ch. 13.1 - Find the mean, median, and mode(s), if any, for...Ch. 13.1 - Find the mean, median, and mode(s), if any, for...Ch. 13.1 - Find the mean, median, and mode(s), if any, for...Ch. 13.1 - Find the mean, median, and mode(s), if any, for...Ch. 13.1 - Find the mean, median, and mode(s), if any, for...Ch. 13.1 - a. If exactly one number in a set of data is...Ch. 13.1 - If a t of data has a mode, then must the mode be...Ch. 13.1 - Academy Awards The following table displays the...Ch. 13.1 - Academy Awards The following table displays the...Ch. 13.1 - Dental Schools Dental schools provide urban...Ch. 13.1 - Expense Reports A salesperson records the...Ch. 13.1 - Use the above grading system to find each students...Ch. 13.1 - Use the above grading system to find each students...Ch. 13.1 - Use the above grading system to find each students...Ch. 13.1 - Use the above grading system to find each students...Ch. 13.1 - Calculate a Course Grade A professor grades...Ch. 13.1 - Calculate a Course Grade A professor grades...Ch. 13.1 - Baseball In baseball, a batters slugging average,...Ch. 13.1 - Baseball In baseball, a batters slugging average,...Ch. 13.1 - Baseball In baseball, a batters slugging average,...Ch. 13.1 - Baseball In baseball, a batters slugging average,...Ch. 13.1 - Find the mean, the median, and all modes for the...Ch. 13.1 - Find the mean, the median, and all modes for the...Ch. 13.1 - Find the mean, the median, and all modes for the...Ch. 13.1 - Find the mean, the median, and all modes for the...Ch. 13.1 - Use the following information about another...Ch. 13.1 - Use the following information about another...Ch. 13.1 - Use the following information about another...Ch. 13.1 - Use the following information about another...Ch. 13.1 - Test Scores After 6 biology tests. Ruben has a...Ch. 13.1 - Test Scores After 4 algebra tests. Alisa has a...Ch. 13.1 - Baseball For the first half of a baseball season,...Ch. 13.1 - Commuting Times Mark averaged 60 mph during the...Ch. 13.1 - Consider the data in the following table. Summary...Ch. 13.1 - Consider the data in the following table. Summary...Ch. 13.2 - This exercise makes use of the geometric procedure...Ch. 13.2 - a. to g. Repeat all of the steps described in...Ch. 13.2 - Meteorology During a 12-hour period on December...Ch. 13.2 - Meteorology During a 2-hour period on January 12....Ch. 13.2 - Find the range, the standard deviation, and the...Ch. 13.2 - Find the range, the standard deviation, and the...Ch. 13.2 - Find the range, the standard deviation, and the...Ch. 13.2 - Find the range, the standard deviation, and the...Ch. 13.2 - Find the range, the standard deviation, and the...Ch. 13.2 - Find the range, the standard deviation, and the...Ch. 13.2 - Find the range, the standard deviation, and the...Ch. 13.2 - Find the range, the standard deviation, and the...Ch. 13.2 - Find the range, the standard deviation, and the...Ch. 13.2 - Find the range, the standard deviation, and the...Ch. 13.2 - Mountain Climbing A mountain climber plans to buy...Ch. 13.2 - Lotteries Which would you expect to be larger: the...Ch. 13.2 - Weights of Students Which would you expect to be...Ch. 13.2 - Evaluate the accuracy of the following statement:...Ch. 13.2 - Fuel Efficiency The fuel efficiency, in miles per...Ch. 13.2 - Waiting Times A customer at a specialty coffee...Ch. 13.2 - Fast-food Calories A survey of 10 fast-food...Ch. 13.2 - Energy Drinks A survey of 16 energy drinks noted...Ch. 13.2 - Weekly Commute Times A survey of 15 large cities...Ch. 13.2 - Biology Some studies show that the mean normal...Ch. 13.2 - Recording Industry The table below shows a random...Ch. 13.2 - Pick 5 numbers and compute the population standard...Ch. 13.2 - Pick 6 numbers and compute the population standard...Ch. 13.2 - a. All of the numbers in a sample are the same...Ch. 13.2 - 27. Under what condition would the variance of a...Ch. 13.3 - The following table lists the ages of customers...Ch. 13.3 - Two groups of people were pan of a test to...Ch. 13.3 - The exercise heart rate, in beats per minute...Ch. 13.3 - Round each z-score to the nearest hundredth. A...Ch. 13.3 - Round each z-score to the nearest hundredth. A...Ch. 13.3 - Round each z-score to the nearest hundredth. A...Ch. 13.3 - Round each z-score to the nearest hundredth. A...Ch. 13.3 - Blood Pressure A blood pressure test was given to...Ch. 13.3 - Fruit Juice A random sample of 1000 oranges showed...Ch. 13.3 - Cholesterol A test involving 380 men ages 20 to 24...Ch. 13.3 - Tire Wear A random sample of 80 tires showed that...Ch. 13.3 - Test Scores Which of the following three test...Ch. 13.3 - Physical Fitness Which of the following Illness...Ch. 13.3 - Reading Test On a reading (est. Shaylens score of...Ch. 13.3 - Placement Exams On a placement examination. Rick...Ch. 13.3 - Test Scores Kevin scored at the 65th percentile on...Ch. 13.3 - 14. Test Scores Rene scored at the 84th percentile...Ch. 13.3 - Median Income In 2015, the median family income in...Ch. 13.3 - Monthly Rents A recent survey by the U.S. Census...Ch. 13.3 - Commute to School A survey was given to 18...Ch. 13.3 - Prescriptions The following table shows the number...Ch. 13.3 - Home Sales The accompanying table shows the median...Ch. 13.3 - The table below shows the heights, in inches. of...Ch. 13.3 - The table below shows the numbers of bushels of...Ch. 13.3 - 22. The blood lead concentrations, in micrograms...Ch. 13.3 - 23. a. The population 3, 4, 9, 14, and 20 has a...Ch. 13.3 - For each of the following, determine whether the...Ch. 13.4 - A professor finds that the grades in a large class...Ch. 13.4 - The results of a statew1e examination of the...Ch. 13.4 - A secondary school system finds that the...Ch. 13.4 - Boys Heights Humans are, on average, taller today...Ch. 13.4 - Biology A biologist measured the lengths of...Ch. 13.4 - Use the Empirical Rule to answer each question. In...Ch. 13.4 - Use the Empirical Rule to answer each question. In...Ch. 13.4 - Use the Empirical Rule to answer each question....Ch. 13.4 - Use the Empirical Rule to answer each question....Ch. 13.4 - Use the Empirical Rule to answer each question....Ch. 13.4 - Use the Empirical Rule to answer each question....Ch. 13.4 - Find the area, to the nearest thousandth, of the...Ch. 13.4 - Find the area, to the nearest thousandth, of the...Ch. 13.4 - Find the area, to the nearest thousandth, of the...Ch. 13.4 - Find the area, to the nearest thousandth, of the...Ch. 13.4 - Find the area, to the nearest thousandth, of the...Ch. 13.4 - Find the area, to the nearest thousandth, of the...Ch. 13.4 - Find the area, to the nearest thousandth, of the...Ch. 13.4 - Find the area, to the nearest thousandth, of the...Ch. 13.4 - Find the area, to the nearest thousandth, of the...Ch. 13.4 - Find the area, to the nearest thousandth, of the...Ch. 13.4 - Find the area, to the nearest thousandth, of the...Ch. 13.4 - Find the area, to the nearest thousandth, of the...Ch. 13.4 - Find the area, to the nearest thousandth, of the...Ch. 13.4 - Find the area, to the nearest thousandth, of the...Ch. 13.4 - Find the area, to the nearest thousandth, of the...Ch. 13.4 - Find the area, to the nearest thousandth, of the...Ch. 13.4 - Find the z-score, to the nearest hundredth, that...Ch. 13.4 - Find the z-score, to the nearest hundredth, that...Ch. 13.4 - Find the z-score, to the nearest hundredth, that...Ch. 13.4 - Find the z-score, to the nearest hundredth, that...Ch. 13.4 - Find the z-score, to the nearest hundredth, that...Ch. 13.4 - Find the z-score, to the nearest hundredth, that...Ch. 13.4 - In Exercises 31 to 40, answer each question. Round...Ch. 13.4 - In Exercises 31 to 40, answer each question. Round...Ch. 13.4 - In Exercises 31 to 40, answer each question. Round...Ch. 13.4 - In Exercises 31 to 40, answer each question. Round...Ch. 13.4 - In Exercises 31 to 40, answer each question. Round...Ch. 13.4 - In Exercises 31 to 40, answer each question. Round...Ch. 13.4 - In Exercises 31 to 40, answer each question. Round...Ch. 13.4 - In Exercises 31 to 40, answer each question. Round...Ch. 13.4 - In Exercises 31 to 40, answer each question. Round...Ch. 13.4 - In Exercises 31 to 40, answer each question. Round...Ch. 13.4 - Heights Consider the data set of the heights of...Ch. 13.4 - Weights Consider the data set of the weights - of...Ch. 13.4 - In Exercises 43 to 49, determine whether the given...Ch. 13.4 - In Exercises 43 to 49, determine whether the given...Ch. 13.4 - In Exercises 43 to 49, determine whether the given...Ch. 13.4 - In Exercises 43 to 49, determine whether the given...Ch. 13.4 - In Exercises 43 to 49, determine whether the given...Ch. 13.4 - In Exercises 43 to 49, determine whether the given...Ch. 13.4 - In Exercises 43 to 49, determine whether the given...Ch. 13.4 - a. Make a sketch of two normal distributions that...Ch. 13.4 - Determine the approximate z-scores for the first...Ch. 13.5 - The following table shows Earths atmospheric...Ch. 13.5 - Which of the scatter diagrams below suggests the...Ch. 13.5 - Which of the scatter diagrams below suggests a. a...Ch. 13.5 - Prob. 3ESCh. 13.5 - Given the bivariate data: a. Draw a scatter...Ch. 13.5 - Find the equation of the least squares line and...Ch. 13.5 - Find the equation of the least squares line and...Ch. 13.5 - Find the equation of the least squares line and...Ch. 13.5 - Find the equation of the least squares line and...Ch. 13.5 - Find the equation of the least squares line and...Ch. 13.5 - Find the equation of the least squares line and...Ch. 13.5 - Use the statistics features of a graphing...Ch. 13.5 - Use the statistics features of a graphing...Ch. 13.5 - Use the statistics features of a graphing...Ch. 13.5 - Use the statistics features of a graphing...Ch. 13.5 - Use the statistics features of a graphing...Ch. 13.5 - Life Expectancy The average remaining life times...Ch. 13.5 - Use the statistics features of a graphing...Ch. 13.5 - Use the statistics features of a graphing...Ch. 13.5 - Tuition The following table shows the average...Ch. 13.5 - ____ Search for bivariate data (in a magazine. in...Ch. 13 - Find the mean, median, mode, range, population...Ch. 13 - A set of data has a mean of 16, a median of 15,...Ch. 13 - Write a set of data with five data values for...Ch. 13 - State whether the mean, Median, or mode is being...Ch. 13 - Bridges The lengths of cantilever bridges in the...Ch. 13 - Average Speed Cleone traveled 45 ml to her sisters...Ch. 13 - Grade Point Average In a 4.0 grading system, each...Ch. 13 - Test Scores A teacher finds that the test scores...Ch. 13 - Airline Industry An airline recorded the times it...Ch. 13 - Ticket Prices The following table gives the...Ch. 13 - Test Scores One student received test ores of 85,...Ch. 13 - A population data set has a mean of 81 and a...Ch. 13 - Cholesterol Levels The cholesterol levels for 10...Ch. 13 - Test Scores The following histogram shows the...Ch. 13 - Teacher Salaries Use the following relative...Ch. 13 - Greenhouse Gas Emissions The table below shows...Ch. 13 - Alternative Fuels Alternative fuel vehicles that...Ch. 13 - Test Scores A professor gave a final examination...Ch. 13 - Waiting Time The amount of time customers spend...Ch. 13 - Pet Food The weights of all the sacks of dog food...Ch. 13 - Telecommunication A telephone manufacturer finds...Ch. 13 - Astronomy The following table gives the distances,...Ch. 13 - Given the bivariate data a. Draw a scatter diagram...Ch. 13 - Physics A student has recorded the data in the...Ch. 13 - 25. ____ Internet A test of an Internet service...Ch. 13 - Blood alcohol content (BAC) is measured in grams...Ch. 13 - Find the mean, median, and mode for the following...Ch. 13 - Grade Point Average Use the 4.0 grading system:...Ch. 13 - Find the range, standard deviation, and variance...Ch. 13 - A sample data set has a mean of x=65 and a...Ch. 13 - Basketball Draw a box-and-whisker plot for the...Ch. 13 - Movie Attendance Use the following relative...Ch. 13 - During I month, an overnight delivery company...Ch. 13 - Box Weights The weights of all the boxes of cake...Ch. 13 - A psychologist wants to determine whether there is...Ch. 13 - Nutrition The following table shows the percent of...
Knowledge Booster


Learn more about
Need a deep-dive on the concept behind this application? Look no further. Learn more about this topic, subject and related others by exploring similar questions and additional content below.Similar questions
- answer number 2arrow_forward4. Linear Regression - Model Assumptions and Interpretation A real estate analyst is studying how house prices (Y) are related to house size in square feet (X). A simple linear regression model is proposed: The analyst fits the model and obtains: • Ŷ50,000+150X YBoB₁X + € • R² = 0.76 • Residuals show a fan-shaped pattern when plotted against fitted values. Questions: a) Interpret the slope coefficient in context. b) Explain what the R² value tells us about the model's performance. c) Based on the residual pattern, what regression assumption is likely violated? What might be the consequence? d) Suggest at least two remedies to improve the model, based on the residual analysis.arrow_forward5. Probability Distributions – Continuous Random Variables A factory machine produces metal rods whose lengths (in cm) follow a continuous uniform distribution on the interval [98, 102]. Questions: a) Define the probability density function (PDF) of the rod length.b) Calculate the probability that a randomly selected rod is shorter than 99 cm.c) Determine the expected value and variance of rod lengths.d) If a sample of 25 rods is selected, what is the probability that their average length is between 99.5 cm and 100.5 cm? Justify your answer using the appropriate distribution.arrow_forward
- 2. Hypothesis Testing - Two Sample Means A nutritionist is investigating the effect of two different diet programs, A and B, on weight loss. Two independent samples of adults were randomly assigned to each diet for 12 weeks. The weight losses (in kg) are normally distributed. Sample A: n = 35, 4.8, s = 1.2 Sample B: n=40, 4.3, 8 = 1.0 Questions: a) State the null and alternative hypotheses to test whether there is a significant difference in mean weight loss between the two diet programs. b) Perform a hypothesis test at the 5% significance level and interpret the result. c) Compute a 95% confidence interval for the difference in means and interpret it. d) Discuss assumptions of this test and explain how violations of these assumptions could impact the results.arrow_forward1. Sampling Distribution and the Central Limit Theorem A company produces batteries with a mean lifetime of 300 hours and a standard deviation of 50 hours. The lifetimes are not normally distributed—they are right-skewed due to some batteries lasting unusually long. Suppose a quality control analyst selects a random sample of 64 batteries from a large production batch. Questions: a) Explain whether the distribution of sample means will be approximately normal. Justify your answer using the Central Limit Theorem. b) Compute the mean and standard deviation of the sampling distribution of the sample mean. c) What is the probability that the sample mean lifetime of the 64 batteries exceeds 310 hours? d) Discuss how the sample size affects the shape and variability of the sampling distribution.arrow_forwardAn airplane flies due west at an airspeed of 428 mph. The wind blows in the direction of 41° south of west at 50 mph. What is the ground speed of the airplane? What is the bearing of the airplane? 428 mph 41° 50 mph a. The ground speed of the airplane is b. The bearing of the airplane is mph. south of west.arrow_forward
- Rylee's car is stuck in the mud. Roman and Shanice come along in a truck to help pull her out. They attach one end of a tow strap to the front of the car and the other end to the truck's trailer hitch, and the truck starts to pull. Meanwhile, Roman and Shanice get behind the car and push. The truck generates a horizontal force of 377 lb on the car. Roman and Shanice are pushing at a slight upward angle and generate a force of 119 lb on the car. These forces can be represented by vectors, as shown in the figure below. The angle between these vectors is 20.2°. Find the resultant force (the vector sum), then give its magnitude and its direction angle from the positive x-axis. 119 lb 20.2° 377 lb a. The resultant force is (Tip: omit degree notations from your answers; e.g. enter cos(45) instead of cos(45°)) b. It's magnitude is lb. c. It's angle from the positive x-axis isarrow_forwardComplete the table below. For solutions, round to the nearest whole number.arrow_forwardA biologist is investigating the effect of potential plant hormones by treating 20 stem segments. At the end of the observation period he computes the following length averages: Compound X = 1.18 Compound Y = 1.17 Based on these mean values he concludes that there are no treatment differences. 1) Are you satisfied with his conclusion? Why or why not? 2) If he asked you for help in analyzing these data, what statistical method would you suggest that he use to come to a meaningful conclusion about his data and why? 3) Are there any other questions you would ask him regarding his experiment, data collection, and analysis methods?arrow_forward
- Businessarrow_forwardAnswer first questionarrow_forwardLet the universal set be whole numbers 1 through 20 inclusive. That is, U = {1, 2, 3, 4, . . ., 19, 20}. Let A, B, and C be subsets of U. Let A be the set of all prime numbers: A = {2, 3, 5, 7, 11, 13, 17, 19} Let B be the set of all odd numbers: B = {1,3,5,7, . . ., 17, 19} Let C be the set of all square numbers: C = {1,4,9,16}arrow_forward
arrow_back_ios
SEE MORE QUESTIONS
arrow_forward_ios
Recommended textbooks for you
 Glencoe Algebra 1, Student Edition, 9780079039897...AlgebraISBN:9780079039897Author:CarterPublisher:McGraw Hill
 Big Ideas Math A Bridge To Success Algebra 1: Stu...AlgebraISBN:9781680331141Author:HOUGHTON MIFFLIN HARCOURTPublisher:Houghton Mifflin Harcourt
 Holt Mcdougal Larson Pre-algebra: Student Edition...AlgebraISBN:9780547587776Author:HOLT MCDOUGALPublisher:HOLT MCDOUGAL
Glencoe Algebra 1, Student Edition, 9780079039897...
Algebra
ISBN:9780079039897
Author:Carter
Publisher:McGraw Hill
Big Ideas Math A Bridge To Success Algebra 1: Stu...
Algebra
ISBN:9781680331141
Author:HOUGHTON MIFFLIN HARCOURT
Publisher:Houghton Mifflin Harcourt
Holt Mcdougal Larson Pre-algebra: Student Edition...
Algebra
ISBN:9780547587776
Author:HOLT MCDOUGAL
Publisher:HOLT MCDOUGAL
The Shape of Data: Distributions: Crash Course Statistics #7; Author: CrashCourse;https://www.youtube.com/watch?v=bPFNxD3Yg6U;License: Standard YouTube License, CC-BY
Shape, Center, and Spread - Module 20.2 (Part 1); Author: Mrmathblog;https://www.youtube.com/watch?v=COaid7O_Gag;License: Standard YouTube License, CC-BY
Shape, Center and Spread; Author: Emily Murdock;https://www.youtube.com/watch?v=_YyW0DSCzpM;License: Standard Youtube License