
Applied Statistics in Business and Economics
5th Edition
ISBN: 9780077837303
Author: David Doane, Lori Seward Senior Instructor of Operations Management
Publisher: McGraw-Hill Education
expand_more
expand_more
format_list_bulleted
Concept explainers
Videos
Textbook Question
Chapter 13.1, Problem 1SE
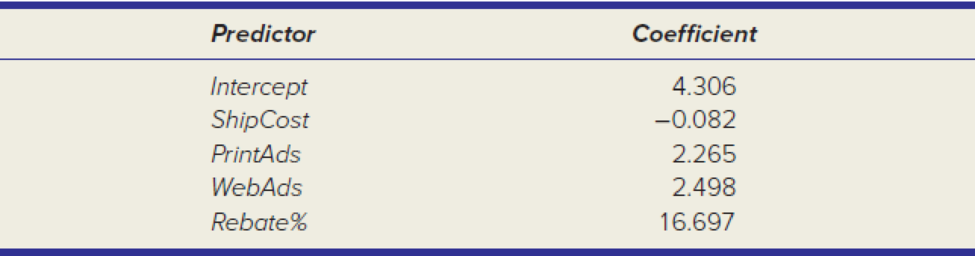
Observations are taken on net revenue from sales of a certain LCD TV at 50 retail outlets. The regression model was Y = net revenue (thousands of dollars), X1 = shipping cost (dollars per unit), X2 = expenditures on print advertising (thousands of dollars), X3 = expenditure on electronic media ads (thousands), X4 = rebate rate (percent of retail price). (a) Write the fitted regression equation. (b) Interpret each coefficient. (c) Would the intercept be likely to have meaning in this regression? (d) Use the fitted equation to make a prediction for NetRevenue when ShipCost = 10, PrintAds = 50, WebAds = 40, and Rebate% = 15.
Expert Solution & Answer
Want to see the full answer?
Check out a sample textbook solution
Students have asked these similar questions
A biologist is investigating the effect of potential plant
hormones by treating 20 stem segments. At the end of
the observation period he computes the following length
averages:
Compound X = 1.18
Compound Y = 1.17
Based on these mean values he concludes that there are
no treatment differences.
1) Are you satisfied with his conclusion? Why or why
not?
2) If he asked you for help in analyzing these data, what
statistical method would you suggest that he use to
come to a meaningful conclusion about his data and
why?
3) Are there any other questions you would ask him
regarding his experiment, data collection, and analysis
methods?
Business
What is the solution and answer to question?
Chapter 13 Solutions
Applied Statistics in Business and Economics
Ch. 13.1 - Observations are taken on net revenue from sales...Ch. 13.1 - Observations are taken on sales of a certain...Ch. 13.1 - Prob. 3SECh. 13.1 - A regression model to predict Y, the...Ch. 13.2 - Refer to the ANOVA table below. (a) State the...Ch. 13.2 - Refer to the ANOVA table below. (a) State the...Ch. 13.2 - Prob. 7SECh. 13.2 - Refer to the ANOVA table below. (a) State the...Ch. 13.3 - Observations are taken on net revenue from sales...Ch. 13.3 - Observations are taken on sales of a certain...
Ch. 13.3 - Prob. 11SECh. 13.3 - A regression model to predict Y, the state...Ch. 13.4 - A regression of accountants starting salaries in a...Ch. 13.4 - An agribusiness performed a regression of wheat...Ch. 13.5 - Prob. 15SECh. 13.5 - A regression model to predict the price of...Ch. 13.5 - Prob. 17SECh. 13.5 - Prob. 18SECh. 13.6 - Prob. 19SECh. 13.6 - Prob. 20SECh. 13.7 - Prob. 21SECh. 13.7 - Using the Metals data, construct a correlation...Ch. 13.8 - Prob. 23SECh. 13.8 - Which violations of regression assumptions, if...Ch. 13 - (a) List two limitations of simple regression. (b)...Ch. 13 - (a) What does represent in the regression model?...Ch. 13 - Prob. 3CRCh. 13 - Prob. 4CRCh. 13 - Prob. 5CRCh. 13 - Prob. 6CRCh. 13 - Prob. 7CRCh. 13 - Prob. 8CRCh. 13 - Prob. 9CRCh. 13 - (a) State the formula for the standard error of...Ch. 13 - (a) What is a categorical predictor? (b) Why is a...Ch. 13 - Prob. 12CRCh. 13 - Prob. 13CRCh. 13 - (a) What is multicollinearity? (b) What are its...Ch. 13 - Prob. 15CRCh. 13 - (a) State the formula for a variance inflation...Ch. 13 - Prob. 17CRCh. 13 - Prob. 18CRCh. 13 - Prob. 19CRCh. 13 - Prob. 20CRCh. 13 - (a) Name two ways to detect autocorrelated...Ch. 13 - (a) What is a lurking variable? How might it be...Ch. 13 - Instructions for Data Sets: Choose one of the data...Ch. 13 - Note: Exercises marked are based on optional...Ch. 13 - Prob. 27CECh. 13 - Note: Exercises marked are based on optional...Ch. 13 - Note: Exercises marked are based on optional...Ch. 13 - Prob. 30CECh. 13 - Prob. 31CECh. 13 - Prob. 32CECh. 13 - Prob. 33CECh. 13 - Prob. 34CECh. 13 - Prob. 35CECh. 13 - Note: Exercises marked are based on optional...Ch. 13 - Note: Exercises marked are based on optional...Ch. 13 - Note: Exercises marked are based on optional...Ch. 13 - Prob. 39CECh. 13 - Prob. 40CECh. 13 - Prob. 41CECh. 13 - In a model of Fords quarterly revenue TotalRevenue...Ch. 13 - In a study of paint peel problems, a regression...Ch. 13 - A hospital emergency room analyzed n = 17,664...Ch. 13 - Prob. 45CECh. 13 - A researcher used stepwise regression to create...Ch. 13 - A sports enthusiast created an equation to predict...Ch. 13 - An expert witness in a case of alleged racial...Ch. 13 - Prob. 50CECh. 13 - Prob. 51CECh. 13 - Prob. 52CECh. 13 - Which statement is correct concerning one-factor...Ch. 13 - Prob. 2ERQCh. 13 - Prob. 3ERQCh. 13 - Prob. 4ERQCh. 13 - Prob. 5ERQCh. 13 - Prob. 6ERQCh. 13 - Prob. 7ERQCh. 13 - Prob. 8ERQCh. 13 - Prob. 9ERQCh. 13 - Prob. 10ERQCh. 13 - Prob. 11ERQCh. 13 - Prob. 12ERQCh. 13 - Prob. 13ERQCh. 13 - Prob. 14ERQCh. 13 - Prob. 15ERQ
Knowledge Booster


Learn more about
Need a deep-dive on the concept behind this application? Look no further. Learn more about this topic, statistics and related others by exploring similar questions and additional content below.Similar questions
- To: [Boss's Name] From: Nathaniel D Sain Date: 4/5/2025 Subject: Decision Analysis for Business Scenario Introduction to the Business Scenario Our delivery services business has been experiencing steady growth, leading to an increased demand for faster and more efficient deliveries. To meet this demand, we must decide on the best strategy to expand our fleet. The three possible alternatives under consideration are purchasing new delivery vehicles, leasing vehicles, or partnering with third-party drivers. The decision must account for various external factors, including fuel price fluctuations, demand stability, and competition growth, which we categorize as the states of nature. Each alternative presents unique advantages and challenges, and our goal is to select the most viable option using a structured decision-making approach. Alternatives and States of Nature The three alternatives for fleet expansion were chosen based on their cost implications, operational efficiency, and…arrow_forwardBusinessarrow_forwardWhy researchers are interested in describing measures of the center and measures of variation of a data set?arrow_forward
- WHAT IS THE SOLUTION?arrow_forwardThe following ordered data list shows the data speeds for cell phones used by a telephone company at an airport: A. Calculate the Measures of Central Tendency from the ungrouped data list. B. Group the data in an appropriate frequency table. C. Calculate the Measures of Central Tendency using the table in point B. 0.8 1.4 1.8 1.9 3.2 3.6 4.5 4.5 4.6 6.2 6.5 7.7 7.9 9.9 10.2 10.3 10.9 11.1 11.1 11.6 11.8 12.0 13.1 13.5 13.7 14.1 14.2 14.7 15.0 15.1 15.5 15.8 16.0 17.5 18.2 20.2 21.1 21.5 22.2 22.4 23.1 24.5 25.7 28.5 34.6 38.5 43.0 55.6 71.3 77.8arrow_forwardII Consider the following data matrix X: X1 X2 0.5 0.4 0.2 0.5 0.5 0.5 10.3 10 10.1 10.4 10.1 10.5 What will the resulting clusters be when using the k-Means method with k = 2. In your own words, explain why this result is indeed expected, i.e. why this clustering minimises the ESS map.arrow_forward
- why the answer is 3 and 10?arrow_forwardPS 9 Two films are shown on screen A and screen B at a cinema each evening. The numbers of people viewing the films on 12 consecutive evenings are shown in the back-to-back stem-and-leaf diagram. Screen A (12) Screen B (12) 8 037 34 7 6 4 0 534 74 1645678 92 71689 Key: 116|4 represents 61 viewers for A and 64 viewers for B A second stem-and-leaf diagram (with rows of the same width as the previous diagram) is drawn showing the total number of people viewing films at the cinema on each of these 12 evenings. Find the least and greatest possible number of rows that this second diagram could have. TIP On the evening when 30 people viewed films on screen A, there could have been as few as 37 or as many as 79 people viewing films on screen B.arrow_forwardQ.2.4 There are twelve (12) teams participating in a pub quiz. What is the probability of correctly predicting the top three teams at the end of the competition, in the correct order? Give your final answer as a fraction in its simplest form.arrow_forward
- The table below indicates the number of years of experience of a sample of employees who work on a particular production line and the corresponding number of units of a good that each employee produced last month. Years of Experience (x) Number of Goods (y) 11 63 5 57 1 48 4 54 5 45 3 51 Q.1.1 By completing the table below and then applying the relevant formulae, determine the line of best fit for this bivariate data set. Do NOT change the units for the variables. X y X2 xy Ex= Ey= EX2 EXY= Q.1.2 Estimate the number of units of the good that would have been produced last month by an employee with 8 years of experience. Q.1.3 Using your calculator, determine the coefficient of correlation for the data set. Interpret your answer. Q.1.4 Compute the coefficient of determination for the data set. Interpret your answer.arrow_forwardCan you answer this question for mearrow_forwardTechniques QUAT6221 2025 PT B... TM Tabudi Maphoru Activities Assessments Class Progress lIE Library • Help v The table below shows the prices (R) and quantities (kg) of rice, meat and potatoes items bought during 2013 and 2014: 2013 2014 P1Qo PoQo Q1Po P1Q1 Price Ро Quantity Qo Price P1 Quantity Q1 Rice 7 80 6 70 480 560 490 420 Meat 30 50 35 60 1 750 1 500 1 800 2 100 Potatoes 3 100 3 100 300 300 300 300 TOTAL 40 230 44 230 2 530 2 360 2 590 2 820 Instructions: 1 Corall dawn to tha bottom of thir ceraan urina se se tha haca nariad in archerca antarand cubmit Q Search ENG US 口X 2025/05arrow_forward
arrow_back_ios
SEE MORE QUESTIONS
arrow_forward_ios
Recommended textbooks for you
 Glencoe Algebra 1, Student Edition, 9780079039897...AlgebraISBN:9780079039897Author:CarterPublisher:McGraw Hill
 Functions and Change: A Modeling Approach to Coll...AlgebraISBN:9781337111348Author:Bruce Crauder, Benny Evans, Alan NoellPublisher:Cengage Learning
 Big Ideas Math A Bridge To Success Algebra 1: Stu...AlgebraISBN:9781680331141Author:HOUGHTON MIFFLIN HARCOURTPublisher:Houghton Mifflin Harcourt
Glencoe Algebra 1, Student Edition, 9780079039897...
Algebra
ISBN:9780079039897
Author:Carter
Publisher:McGraw Hill
Functions and Change: A Modeling Approach to Coll...
Algebra
ISBN:9781337111348
Author:Bruce Crauder, Benny Evans, Alan Noell
Publisher:Cengage Learning
Big Ideas Math A Bridge To Success Algebra 1: Stu...
Algebra
ISBN:9781680331141
Author:HOUGHTON MIFFLIN HARCOURT
Publisher:Houghton Mifflin Harcourt
Correlation Vs Regression: Difference Between them with definition & Comparison Chart; Author: Key Differences;https://www.youtube.com/watch?v=Ou2QGSJVd0U;License: Standard YouTube License, CC-BY
Correlation and Regression: Concepts with Illustrative examples; Author: LEARN & APPLY : Lean and Six Sigma;https://www.youtube.com/watch?v=xTpHD5WLuoA;License: Standard YouTube License, CC-BY