
Concept explainers
Videos
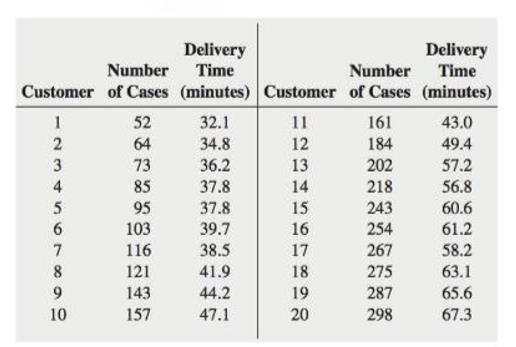
Management of a soft-drink bottling company has the business objective of developing a method for allocating delivery costs to customers. Although one cost clearly relates to travel time within a particular route, another variable cost reflects the time required to unload the cases of soft drink at the delivery point. To begin, management decided to develop a regression model to predict delivery time based on the number of cases delivered. A sample of 20 deliveries within a territory was selected. The delivery times and the number of cases delivered were organized in the following table and stored in Delivery:
a. Use the least-squares method to compute the regression coefficients
b. Interpret the meaning of
c. Predict the
d. Should you use the model to predict the delivery time for a customer who is receiving 500 cases of soft drink? Why or why not?
e. Determine the coefficient of determination,
f. Perform a residual analysis. Is there any evidence of a pattern in the residuals? Explain.
g. At the 0.05 level of significance, is there evidence of a linear relationship between delivery time and the number of cases delivered?
h. Construct a 95% confidence
i. What conclusions can you reach from (a)-(h) about the relationship between the number of cases and delivery time?
Want to see the full answer?
Check out a sample textbook solution
Chapter 13 Solutions
Student Solutions Manual for Basic Business Statistics


- 10 Meteorologists use computer models to predict when and where a hurricane will hit shore. Suppose they predict that hurricane Stat has a 20 percent chance of hitting the East Coast. a. On what info are the meteorologists basing this prediction? b. Why is this prediction harder to make than your chance of getting a head on your next coin toss? U anoiaarrow_forward6. Show that one cannot find independent, identically distributed random variables X and Y such that X-YE U(-1, 1). 7 Consider al onarrow_forward2 Which situation is more likely to produce exactly 50 percent heads: flipping a coin 10 times or flipping a coin 10,000 times?arrow_forward
- 2. Let X1, X2..... X, be independent random variables with expectation 0 and finite third moments. Show, with the aid of characteristic functions, that E(X₁ + X₂++X)³ = EX² + EX²++ EX₁₂-arrow_forward21 Check out the sales of a particular car across the United States over a 60-day period in the following figure. 800- 700- 600- Number of items sold 400 500- Line Graph of Sales 3001 16 12 18 24 30 36 42 48 54 60 60 Day a. Can you see a pattern to the sales of this car across this time period? b. What are the highest and lowest numbers of sales, and when did they occur? c. Can Can you estimate the average of all sales over this time period?arrow_forward11 Bob has glued himself to a certain slot machine for four hours in a row now with his bucket of coins and a bad attitude. He doesn't want to leave because he feels the longer he plays, the better chance he has t win eventually. Is poor Bob right?arrow_forward
- 7 You feel lucky again and buy a handful of instant lottery tickets. The last three tickets you open each win a dollar. Should you buy another ticket because you're "on a roll"?arrow_forward5 Suppose that an NBA player's free throw shooting percentage is 70 percent. a. Explain what this means as a probability. b. What's wrong with thinking that his chances of making his next free throw are 50-50 (because he either makes it or he doesn't)? 78 PART 2 Probability.arrow_forwardA couple has conceived three girls so far with a fourth baby on the way. Do you predict the newborn will be a girl or a boy? Why?arrow_forward
- 2 Suppose that you flip a coin four times, and it comes up heads each time. Does this outcome give you reason to believe that the coin isn't legitimate? dedo Raupnu stens My be sunildes ad ndaniver uoy no grin PALO STO 2010 COMO IT COUarrow_forward3 Consider tossing a fair coin 10 times and recording the number of heads that occur. a. How many possible outcomes would occur? b. What would be the probability of each of the outcomes? c. How many of the outcomes would have 1 head? What is the probability of 1 head in 10 flips? how d. How many of the outcomes would have o heads? What is the probability of o heads in 10 flips? e. What's the probability of getting 1 head or less on 10 flips of a fair coin?arrow_forward22 Bob decides that after his heart attack is a good time to get in shape, so he starts exer- cising each day and plans to increase his exercise time as he goes along. Look at the two line graphs shown in the following fig- ures. One is a good representation of his data, and the other should get as much use as Bob's treadmill before his heart attack. Exercise time 40 Line Graph 1 of Exercise Log 35 30- 25 201 20 Exercise time 80 80 60 40- 1 10 20 30 30 40 50 60 Day 170 50 80 Line Graph 2 of Exercise Log 1 10 20 90 100 30 30 40 50 60 70 80 90 100 Day a. Compare the two graphs. Do they repre- sent the same data set, or do they show totally different data sets? b. Assume that both graphs are made from the same data. Which graph is more appropriate and why?arrow_forward
 Big Ideas Math A Bridge To Success Algebra 1: Stu...AlgebraISBN:9781680331141Author:HOUGHTON MIFFLIN HARCOURTPublisher:Houghton Mifflin Harcourt
 Glencoe Algebra 1, Student Edition, 9780079039897...AlgebraISBN:9780079039897Author:CarterPublisher:McGraw Hill
 Functions and Change: A Modeling Approach to Coll...AlgebraISBN:9781337111348Author:Bruce Crauder, Benny Evans, Alan NoellPublisher:Cengage Learning
 Linear Algebra: A Modern IntroductionAlgebraISBN:9781285463247Author:David PoolePublisher:Cengage Learning