
Student Solutions Manual for Basic Business Statistics
13th Edition
ISBN: 9780321926708
Author: David M. Levine; Mark L. Berenson; Timothy C. Krehbiel; Kathryn A. Szabat; David F. Stephan
Publisher: Pearson Education
expand_more
expand_more
format_list_bulleted
Concept explainers
Videos
Textbook Question
Chapter 13, Problem 23PS
The following results provide the
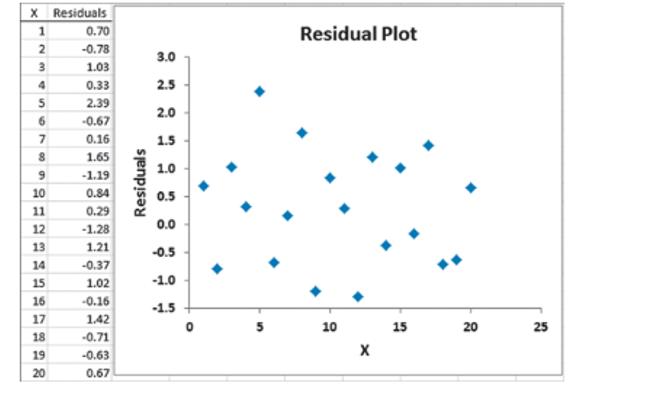
Is there any evidence of a pattern in the residuals? Explain.
Expert Solution & Answer
Want to see the full answer?
Check out a sample textbook solution
Students have asked these similar questions
Show all work
Show all work
Show all work
Chapter 13 Solutions
Student Solutions Manual for Basic Business Statistics
Ch. 13 - Prob. 1PSCh. 13 - If the values of X in Problem 13.1 from 2 to 25,...Ch. 13 - Fitting a straight line to a set data yields the...Ch. 13 - The production of wine is a multibillion-dollar...Ch. 13 - Zagat’s publishes restaurant ratings for various...Ch. 13 - The owner of a moving company typically has his...Ch. 13 - Starbucks Coffee Co. uses a data-based approach to...Ch. 13 - Prob. 8PSCh. 13 - An agent for a residential real estate company in...Ch. 13 - Prob. 10PS
Ch. 13 - How do you interpret a coefficient by of...Ch. 13 - If SSR= 36 and SSE=4, determine SST and then...Ch. 13 - If SSR=66 and SST=88, Compute the coefficient of...Ch. 13 - If SSE= 10 and SSR=30, compute the coefficient of...Ch. 13 - If SSR=120, Why is it impossible for SST to equal...Ch. 13 - In problem 13.4 on page 493, the percentage of...Ch. 13 - Prob. 17PSCh. 13 - Prob. 18PSCh. 13 - In Problem 13.7 on page 494, you used the plate...Ch. 13 - In problem 13.8 on page 494, you used annual...Ch. 13 - In problem 13.9 on page 494, an agent for a real...Ch. 13 - In Problem 13.10 on page 501, you used box office...Ch. 13 - The following results provide the X Values,...Ch. 13 - The following results show the X Values,...Ch. 13 - In problem 13.5 on page 493, you used the summated...Ch. 13 - In problem 13.4 on page 493, you used the...Ch. 13 - In problem 13.7 on page 494, you used the plate...Ch. 13 - In Problem 13.6 on page 501, the owner of a moving...Ch. 13 - In problem 13.9 on page 494, an agent for a real...Ch. 13 - Prob. 30PSCh. 13 - In problem 13.10 on page 501, you used box office...Ch. 13 - The residuals for 10 consecutive time periods are...Ch. 13 - The residuals for 15 consecutive time periods are...Ch. 13 - In Problem 13.7 on page 494 concerning the...Ch. 13 - What is the relationship between the price of...Ch. 13 - Prob. 36PSCh. 13 - A freshly brewed shot of espresso has three...Ch. 13 - The owners of a chain of ice cream stores have the...Ch. 13 - You are testing the null hypothesis that there is...Ch. 13 - Prob. 40PSCh. 13 - Prob. 41PSCh. 13 - In problem 13.4 on page 493, you used the...Ch. 13 - Prob. 43PSCh. 13 - Prob. 44PSCh. 13 - In Problem 13.7 on page 494, you used the plate...Ch. 13 - Prob. 46PSCh. 13 - In Problem 13.9 on page 494, an agent for a real...Ch. 13 - In Problem 13.10 on page 501, you used box office...Ch. 13 - Prob. 49PSCh. 13 - Prob. 50PSCh. 13 - Prob. 51PSCh. 13 - Movie companies need to predict the gross receipts...Ch. 13 - Prob. 53PSCh. 13 - A survey by the Pew Research Center found that...Ch. 13 - Prob. 55PSCh. 13 - Based on a sample of n=20, the latest-squares...Ch. 13 - In Problem 133 on page 500, you used the summated...Ch. 13 - In Problem 13.4 on page 493, you used the...Ch. 13 - In Problem 13.7 on page 494, you used the plate...Ch. 13 - Prob. 60PSCh. 13 - Prob. 61PSCh. 13 - Prob. 62PSCh. 13 - Prob. 63PSCh. 13 - Prob. 64PSCh. 13 - Prob. 65PSCh. 13 - When is the unexplained variation (i.e., error sum...Ch. 13 - Prob. 67PSCh. 13 - Prob. 68PSCh. 13 - Prob. 69PSCh. 13 - How do you evaluate the assumptions of regression...Ch. 13 - When and how do you use the Durbin-Watson...Ch. 13 - Prob. 72PSCh. 13 - Can you use Twitter activity to forecast box...Ch. 13 - Management of a soft-drink bottling company has...Ch. 13 - Measuring the height of a California redwood tree...Ch. 13 - You want to develop a model to predict the...Ch. 13 - Prob. 77PSCh. 13 - The director of graduate studies at a large...Ch. 13 - An accountant for a large department store has the...Ch. 13 - On January 28, 1986, the space shuttle Challenger...Ch. 13 - A baseball analyst would like to study various...Ch. 13 - Can you use the annual revenues generated by...Ch. 13 - In Problem 13.82 you used annual revenue to...Ch. 13 - During the fall harvest season in the United...Ch. 13 - Prob. 85PSCh. 13 - The file CEO 2016 includes the total compensation...Ch. 13 - In Problem 13.8, 13.20, 13.30, 13.46, 13.62,...
Knowledge Booster


Learn more about
Need a deep-dive on the concept behind this application? Look no further. Learn more about this topic, statistics and related others by exploring similar questions and additional content below.Similar questions
- A marketing agency wants to determine whether different advertising platforms generate significantly different levels of customer engagement. The agency measures the average number of daily clicks on ads for three platforms: Social Media, Search Engines, and Email Campaigns. The agency collects data on daily clicks for each platform over a 10-day period and wants to test whether there is a statistically significant difference in the mean number of daily clicks among these platforms. Conduct ANOVA test. You can provide your answer by inserting a text box and the answer must include: also please provide a step by on getting the answers in excel Null hypothesis, Alternative hypothesis, Show answer (output table/summary table), and Conclusion based on the P value.arrow_forwardA company found that the daily sales revenue of its flagship product follows a normal distribution with a mean of $4500 and a standard deviation of $450. The company defines a "high-sales day" that is, any day with sales exceeding $4800. please provide a step by step on how to get the answers Q: What percentage of days can the company expect to have "high-sales days" or sales greater than $4800? Q: What is the sales revenue threshold for the bottom 10% of days? (please note that 10% refers to the probability/area under bell curve towards the lower tail of bell curve) Provide answers in the yellow cellsarrow_forwardBusiness Discussarrow_forward
- The following data represent total ventilation measured in liters of air per minute per square meter of body area for two independent (and randomly chosen) samples. Analyze these data using the appropriate non-parametric hypothesis testarrow_forwardeach column represents before & after measurements on the same individual. Analyze with the appropriate non-parametric hypothesis test for a paired design.arrow_forwardShould you be confident in applying your regression equation to estimate the heart rate of a python at 35°C? Why or why not?arrow_forward
arrow_back_ios
SEE MORE QUESTIONS
arrow_forward_ios
Recommended textbooks for you
 Functions and Change: A Modeling Approach to Coll...AlgebraISBN:9781337111348Author:Bruce Crauder, Benny Evans, Alan NoellPublisher:Cengage Learning
 Glencoe Algebra 1, Student Edition, 9780079039897...AlgebraISBN:9780079039897Author:CarterPublisher:McGraw Hill
 Big Ideas Math A Bridge To Success Algebra 1: Stu...AlgebraISBN:9781680331141Author:HOUGHTON MIFFLIN HARCOURTPublisher:Houghton Mifflin Harcourt
 College AlgebraAlgebraISBN:9781305115545Author:James Stewart, Lothar Redlin, Saleem WatsonPublisher:Cengage Learning
Functions and Change: A Modeling Approach to Coll...
Algebra
ISBN:9781337111348
Author:Bruce Crauder, Benny Evans, Alan Noell
Publisher:Cengage Learning
Glencoe Algebra 1, Student Edition, 9780079039897...
Algebra
ISBN:9780079039897
Author:Carter
Publisher:McGraw Hill
Big Ideas Math A Bridge To Success Algebra 1: Stu...
Algebra
ISBN:9781680331141
Author:HOUGHTON MIFFLIN HARCOURT
Publisher:Houghton Mifflin Harcourt
College Algebra
Algebra
ISBN:9781305115545
Author:James Stewart, Lothar Redlin, Saleem Watson
Publisher:Cengage Learning
Correlation Vs Regression: Difference Between them with definition & Comparison Chart; Author: Key Differences;https://www.youtube.com/watch?v=Ou2QGSJVd0U;License: Standard YouTube License, CC-BY
Correlation and Regression: Concepts with Illustrative examples; Author: LEARN & APPLY : Lean and Six Sigma;https://www.youtube.com/watch?v=xTpHD5WLuoA;License: Standard YouTube License, CC-BY