Concept explainers
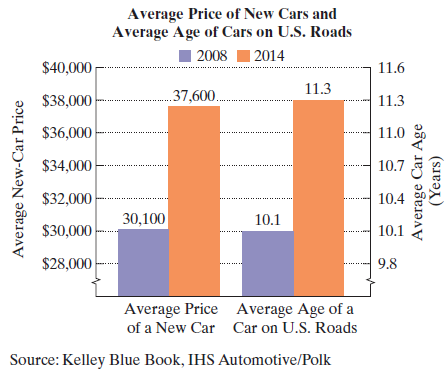
Despite booming new car sales with their cha-ching sounds, the average age of vehicles on U.S. roads is not going down. The bar graph shows the average price of new cars in the United States and average age of cars on U.S. mads for two selected years. Exercises 5-6 are based on the information displayed by the graph.

In 2014, the average age of cars on U.S. roads was 11.3 years. For the period shown, this average age increased by approximately 0.2 year per year. If this trend continues, how many years after 2014 will the average age of vehicles on U.S. roads be 12.3 years? In which year will this occur?
Want to see the full answer?
Check out a sample textbook solution
Chapter 1 Solutions
Algebra and Trigonometry (6th Edition)
Additional Math Textbook Solutions
Math in Our World
Thinking Mathematically (6th Edition)
College Algebra (Collegiate Math)
Introductory Statistics
A Problem Solving Approach To Mathematics For Elementary School Teachers (13th Edition)
Basic College Mathematics
- Plane II is spanned by the vectors: - (2) · P² - (4) P1=2 P21 3 Subspace W is spanned by the vectors: 2 W1 - (9) · 1 W2 1 = (³)arrow_forwardshow that v3 = (−√3, −3, 3)⊤ is an eigenvector of M3 . Also here find the correspondingeigenvalue λ3 . Just from looking at M3 and its components, can you say something about the remaining twoeigenvalues? If so, what would you say? find v42 so that v4 = ( 2/5, v42, 1)⊤ is an eigenvector of M4 with corresp. eigenvalue λ4 = 45arrow_forwardChapter 4 Quiz 2 As always, show your work. 1) FindΘgivencscΘ=1.045. 2) Find Θ given sec Θ = 4.213. 3) Find Θ given cot Θ = 0.579. Solve the following three right triangles. B 21.0 34.6° ca 52.5 4)c 26° 5) A b 6) B 84.0 a 42° barrow_forward
- Q1: A: Let M and N be two subspace of finite dimension linear space X, show that if M = N then dim M = dim N but the converse need not to be true. B: Let A and B two balanced subsets of a linear space X, show that whether An B and AUB are balanced sets or nor. Q2: Answer only two A:Let M be a subset of a linear space X, show that M is a hyperplane of X iff there exists ƒ€ X'/{0} and a € F such that M = (x = x/f&x) = x}. fe B:Show that every two norms on finite dimension linear space are equivalent C: Let f be a linear function from a normed space X in to a normed space Y, show that continuous at x, E X iff for any sequence (x) in X converge to Xo then the sequence (f(x)) converge to (f(x)) in Y. Q3: A:Let M be a closed subspace of a normed space X, constract a linear space X/M as normed space B: Let A be a finite dimension subspace of a Banach space X, show that A is closed. C: Show that every finite dimension normed space is Banach space.arrow_forward• Plane II is spanned by the vectors: P12 P2 = 1 • Subspace W is spanned by the vectors: W₁ = -- () · 2 1 W2 = 0arrow_forwardThree streams - Stream A, Stream B, and Stream C - flow into a lake. The flow rates of these streams are not yet known and thus to be found. The combined water inflow from the streams is 300 m³/h. The rate of Stream A is three times the combined rates of Stream B and Stream C. The rate of Stream B is 50 m³/h less than half of the difference between the rates of Stream A and Stream C. Find the flow rates of the three streams by setting up an equation system Ax = b and solving it for x. Provide the values of A and b. Assuming that you get to an upper-triangular matrix U using an elimination matrix E such that U = E A, provide also the components of E.arrow_forward
- dent Application X GA spinner is divided into five cox | + 9/26583471/4081d162951bfdf39e254aa2151384b7 A spinner is divided into five colored sections that are not of equal size: red, blue, green, yellow, and purple. The spinner is spun several times, and the results are recorded below: Spinner Results Color Frequency Red 5 Blue 11 Green 18 Yellow 5 Purple 7 Based on these results, express the probability that the next spin will land on purple as a fraction in simplest form. Answer Attempt 1 out of 2 Submit Answer 0 Feb 12 10:11 Oarrow_forward2 5x + 2–49 2 x+10x+21arrow_forward5x 2x+y+ 3x + 3y 4 6arrow_forward
- Calculați (a-2023×b)²⁰²⁴arrow_forwardA student completed the problem below. Identify whether the student was correct or incorrect. Explain your reasoning. (identification 1 point; explanation 1 point) 4x 3x (x+7)(x+5)(x+7)(x-3) 4x (x-3) (x+7)(x+5) (x03) 3x (x+5) (x+7) (x-3)(x+5) 4x²-12x-3x²-15x (x+7) (x+5) (x-3) 2 × - 27x (x+7)(x+5) (x-3)arrow_forward2 Add the rational expressions below. Can you add them in this original form? Explain why or why not. 3x-7 5x + x² - 7x+12 4x-12 Show all steps. State your least common denominator and explain in words your process on how you determined your least common denominator. Be sure to state your claim, provide your evidence, and provide your reasoning before submitting.arrow_forward
 Holt Mcdougal Larson Pre-algebra: Student Edition...AlgebraISBN:9780547587776Author:HOLT MCDOUGALPublisher:HOLT MCDOUGAL
 Glencoe Algebra 1, Student Edition, 9780079039897...AlgebraISBN:9780079039897Author:CarterPublisher:McGraw Hill
 Algebra: Structure And Method, Book 1AlgebraISBN:9780395977224Author:Richard G. Brown, Mary P. Dolciani, Robert H. Sorgenfrey, William L. ColePublisher:McDougal Littell
 College Algebra (MindTap Course List)AlgebraISBN:9781305652231Author:R. David Gustafson, Jeff HughesPublisher:Cengage Learning


