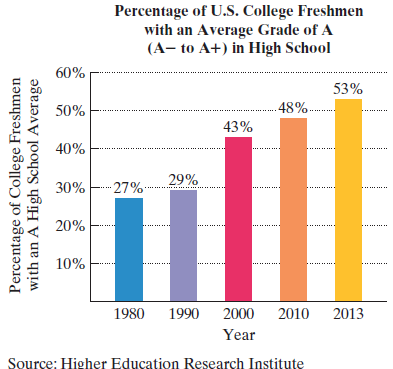
Grade Inflation. The bar graph shows the percentage of U.S. college freshmen with an average grade of A in high school. The data displayed by the bar graph can be described by the mathematical model p = 4 x 5 + 25 , where x is the number of years after 1980 and p is the percentage of U.S. college freshmen who had an average grade of A in high school. Use this information to solve Exercises 97-98 . a. According to the formula, in 2010, what percentage of U.S. college freshmen had an average grade of A in high school? Does this underestimate or overestimate the percent displayed by the bar graph? By how much? b. If trends shown by the formula continue, project when 57% of U.S. college freshmen will have had an average grade of A in high school.
Grade Inflation. The bar graph shows the percentage of U.S. college freshmen with an average grade of A in high school. The data displayed by the bar graph can be described by the mathematical model p = 4 x 5 + 25 , where x is the number of years after 1980 and p is the percentage of U.S. college freshmen who had an average grade of A in high school. Use this information to solve Exercises 97-98 . a. According to the formula, in 2010, what percentage of U.S. college freshmen had an average grade of A in high school? Does this underestimate or overestimate the percent displayed by the bar graph? By how much? b. If trends shown by the formula continue, project when 57% of U.S. college freshmen will have had an average grade of A in high school.
Solution Summary: The author calculates the percentage of U.S. college freshmen that had an average grade of A in high school in 2010.
Grade Inflation.The bar graph shows the percentage of U.S. college freshmen with an average grade of A in high school.
The data displayed by the bar graph can be described by the mathematical model
p
=
4
x
5
+
25
,
where x is the number of years after 1980 and p is the percentage of U.S. college freshmen who had an average grade of A in high school. Use this information to solve Exercises 97-98.
a. According to the formula, in 2010, what percentage of U.S. college freshmen had an average grade of A in high school? Does this underestimate or overestimate the percent displayed by the bar graph? By how much?
b. If trends shown by the formula continue, project when 57% of U.S. college freshmen will have had an average grade of A in high school.
eric
pez
Xte
in
z=
Therefore, we have
(x, y, z)=(3.0000,
83.6.1 Exercise
Gauss-Seidel iteration with
Start with (x, y, z) = (0, 0, 0). Use the convergent Jacobi i
Tol=10 to solve the following systems:
1.
5x-y+z = 10
2x-8y-z=11
-x+y+4z=3
iteration (x
Assi 2
Assi 3.
4.
x-5y-z=-8
4x-y- z=13
2x - y-6z=-2
4x y + z = 7
4x-8y + z = -21
-2x+ y +5z = 15
4x + y - z=13
2x - y-6z=-2
x-5y- z=-8
realme Shot on realme C30
2025.01.31 22:35
f
Use Pascal's triangle to expand the binomial
(6m+2)^2
Listen
A falling object travels a distance given by the formula d = 6t + 9t2 where d is in feet
and t is the time in seconds. How many seconds will it take for the object to travel
112 feet? Round answer to 2 decimal places. (Write the number, not the units).
Your Answer:
Need a deep-dive on the concept behind this application? Look no further. Learn more about this topic, algebra and related others by exploring similar questions and additional content below.
Linear Equation | Solving Linear Equations | What is Linear Equation in one variable ?; Author: Najam Academy;https://www.youtube.com/watch?v=tHm3X_Ta_iE;License: Standard YouTube License, CC-BY


 Glencoe Algebra 1, Student Edition, 9780079039897...AlgebraISBN:9780079039897Author:CarterPublisher:McGraw Hill
 Big Ideas Math A Bridge To Success Algebra 1: Stu...AlgebraISBN:9781680331141Author:HOUGHTON MIFFLIN HARCOURTPublisher:Houghton Mifflin Harcourt
 Mathematics For Machine TechnologyAdvanced MathISBN:9781337798310Author:Peterson, John.Publisher:Cengage Learning,
 Elementary AlgebraAlgebraISBN:9780998625713Author:Lynn Marecek, MaryAnne Anthony-SmithPublisher:OpenStax - Rice University
 Holt Mcdougal Larson Pre-algebra: Student Edition...AlgebraISBN:9780547587776Author:HOLT MCDOUGALPublisher:HOLT MCDOUGAL
 Trigonometry (MindTap Course List)TrigonometryISBN:9781337278461Author:Ron LarsonPublisher:Cengage Learning