
Concept explainers
Videos
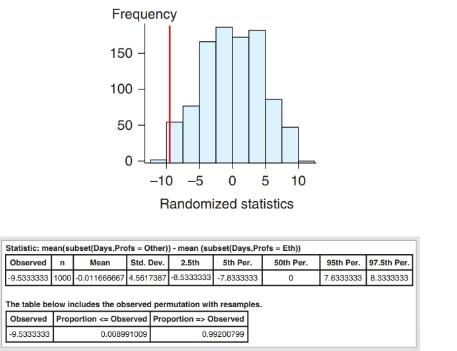
Resampling Moms We performed a randomization test to determine whether the
The histogram shows the results of 1000 randomizations of the data. In each randomization, 30 values were randomly determined to be in the “Ethics” group and the other 30 in the “Other” group. The mean difference was calculated and recorded. Note that the distribution of the differences of these means is centered at about 0, because the randomization forced the null hypothesis to be true.
The observed sample mean time since last contact for professors in other fields minus the sample mean time for ethics professors is shown by the red vertical line. The p-value for the one-sided hypothesis that the mean time since professors in other fields contacted their mothers is less than the mean time for ethics professors is shown in the numerical output. Does this show that ethicists have less recent contact or not, using a significance level of 0.05? Comment on both the histogram and the table of output.
Want to see the full answer?
Check out a sample textbook solution
Chapter 13 Solutions
INTRODUCTORY STAT. W/MYLAB MATH>CUSTOM<
Additional Math Textbook Solutions
Graphical Approach To College Algebra
Elementary Statistics: Picturing the World (7th Edition)
Precalculus: A Unit Circle Approach (3rd Edition)
A Problem Solving Approach To Mathematics For Elementary School Teachers (13th Edition)
Elementary & Intermediate Algebra


- Show all workarrow_forwardplease find the answers for the yellows boxes using the information and the picture belowarrow_forwardA marketing agency wants to determine whether different advertising platforms generate significantly different levels of customer engagement. The agency measures the average number of daily clicks on ads for three platforms: Social Media, Search Engines, and Email Campaigns. The agency collects data on daily clicks for each platform over a 10-day period and wants to test whether there is a statistically significant difference in the mean number of daily clicks among these platforms. Conduct ANOVA test. You can provide your answer by inserting a text box and the answer must include: also please provide a step by on getting the answers in excel Null hypothesis, Alternative hypothesis, Show answer (output table/summary table), and Conclusion based on the P value.arrow_forward
- A company found that the daily sales revenue of its flagship product follows a normal distribution with a mean of $4500 and a standard deviation of $450. The company defines a "high-sales day" that is, any day with sales exceeding $4800. please provide a step by step on how to get the answers Q: What percentage of days can the company expect to have "high-sales days" or sales greater than $4800? Q: What is the sales revenue threshold for the bottom 10% of days? (please note that 10% refers to the probability/area under bell curve towards the lower tail of bell curve) Provide answers in the yellow cellsarrow_forwardBusiness Discussarrow_forwardThe following data represent total ventilation measured in liters of air per minute per square meter of body area for two independent (and randomly chosen) samples. Analyze these data using the appropriate non-parametric hypothesis testarrow_forward
 College Algebra (MindTap Course List)AlgebraISBN:9781305652231Author:R. David Gustafson, Jeff HughesPublisher:Cengage Learning
 Holt Mcdougal Larson Pre-algebra: Student Edition...AlgebraISBN:9780547587776Author:HOLT MCDOUGALPublisher:HOLT MCDOUGAL
 Glencoe Algebra 1, Student Edition, 9780079039897...AlgebraISBN:9780079039897Author:CarterPublisher:McGraw Hill
 Big Ideas Math A Bridge To Success Algebra 1: Stu...AlgebraISBN:9781680331141Author:HOUGHTON MIFFLIN HARCOURTPublisher:Houghton Mifflin Harcourt