
Concept explainers
Videos
Television Viewing A Nielsen poll asked people the number of hours of television they watched in the last week. Assume that Nielsen obtained a random sample. We are analyzing the data for the 39 college students in the sample. The figure shows a dotplot of the distribution.
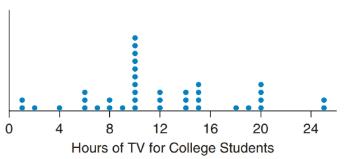
a. Find a 95% confidence interval for the
b. Perform a log transform on the observations, and find a 95% confidence interval for the mean of the log-transformed data.
c. Back transform the boundaries of the confidence interval into units of hours. Interpret the resulting interval.
d. Which interval is better to report and why? Consider the shape and the
Want to see the full answer?
Check out a sample textbook solution
Chapter 13 Solutions
INTRODUCTORY STAT. W/MYLAB MATH>CUSTOM<
Additional Math Textbook Solutions
Elementary Statistics: Picturing the World (7th Edition)
Mathematics for the Trades: A Guided Approach (11th Edition) (What's New in Trade Math)
APPLIED STAT.IN BUS.+ECONOMICS
Elementary Statistics ( 3rd International Edition ) Isbn:9781260092561
Beginning and Intermediate Algebra
College Algebra (Collegiate Math)


- A company found that the daily sales revenue of its flagship product follows a normal distribution with a mean of $4500 and a standard deviation of $450. The company defines a "high-sales day" that is, any day with sales exceeding $4800. please provide a step by step on how to get the answers in excel Q: What percentage of days can the company expect to have "high-sales days" or sales greater than $4800? Q: What is the sales revenue threshold for the bottom 10% of days? (please note that 10% refers to the probability/area under bell curve towards the lower tail of bell curve) Provide answers in the yellow cellsarrow_forwardFind the critical value for a left-tailed test using the F distribution with a 0.025, degrees of freedom in the numerator=12, and degrees of freedom in the denominator = 50. A portion of the table of critical values of the F-distribution is provided. Click the icon to view the partial table of critical values of the F-distribution. What is the critical value? (Round to two decimal places as needed.)arrow_forwardA retail store manager claims that the average daily sales of the store are $1,500. You aim to test whether the actual average daily sales differ significantly from this claimed value. You can provide your answer by inserting a text box and the answer must include: Null hypothesis, Alternative hypothesis, Show answer (output table/summary table), and Conclusion based on the P value. Showing the calculation is a must. If calculation is missing,so please provide a step by step on the answers Numerical answers in the yellow cellsarrow_forward
 Big Ideas Math A Bridge To Success Algebra 1: Stu...AlgebraISBN:9781680331141Author:HOUGHTON MIFFLIN HARCOURTPublisher:Houghton Mifflin Harcourt
 Holt Mcdougal Larson Pre-algebra: Student Edition...AlgebraISBN:9780547587776Author:HOLT MCDOUGALPublisher:HOLT MCDOUGAL
 Glencoe Algebra 1, Student Edition, 9780079039897...AlgebraISBN:9780079039897Author:CarterPublisher:McGraw Hill
 Trigonometry (MindTap Course List)TrigonometryISBN:9781337278461Author:Ron LarsonPublisher:Cengage Learning
 College Algebra (MindTap Course List)AlgebraISBN:9781305652231Author:R. David Gustafson, Jeff HughesPublisher:Cengage Learning