
Videos
Credit Card Debt A statistics student who was interested in credit card debt asked a random sample of students for the total amount of their credit card debt. We eliminated the two women and the one man who had a debt of 0, which left 18 women and 19 men.
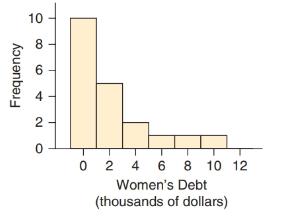
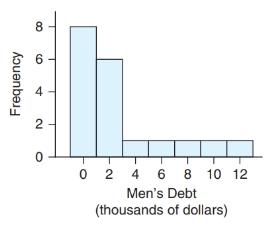
a. By looking at the histograms of the data, determine whether it would be appropriate to do a two-sample t-test using this data set. Explain.
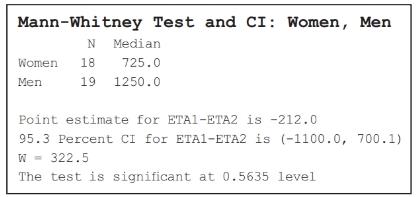
b. Refer to the Minitab output. Which group had a higher
c. Refer to the Minitab output provided to test whether the typical credit card debt (as measured by the median) is different for men and women, using a significance level of 0.05.
Want to see the full answer?
Check out a sample textbook solution
Chapter 13 Solutions
INTRODUCTORY STAT. W/MYLAB MATH>CUSTOM<
Additional Math Textbook Solutions
Beginning and Intermediate Algebra
Elementary & Intermediate Algebra
Precalculus
Elementary and Intermediate Algebra: Concepts and Applications (7th Edition)
Elementary Statistics ( 3rd International Edition ) Isbn:9781260092561
Intermediate Algebra (13th Edition)


- A marketing agency wants to determine whether different advertising platforms generate significantly different levels of customer engagement. The agency measures the average number of daily clicks on ads for three platforms: Social Media, Search Engines, and Email Campaigns. The agency collects data on daily clicks for each platform over a 10-day period and wants to test whether there is a statistically significant difference in the mean number of daily clicks among these platforms. Conduct ANOVA test. You can provide your answer by inserting a text box and the answer must include: also please provide a step by on getting the answers in excel Null hypothesis, Alternative hypothesis, Show answer (output table/summary table), and Conclusion based on the P value.arrow_forwardA company found that the daily sales revenue of its flagship product follows a normal distribution with a mean of $4500 and a standard deviation of $450. The company defines a "high-sales day" that is, any day with sales exceeding $4800. please provide a step by step on how to get the answers Q: What percentage of days can the company expect to have "high-sales days" or sales greater than $4800? Q: What is the sales revenue threshold for the bottom 10% of days? (please note that 10% refers to the probability/area under bell curve towards the lower tail of bell curve) Provide answers in the yellow cellsarrow_forwardBusiness Discussarrow_forward
- The following data represent total ventilation measured in liters of air per minute per square meter of body area for two independent (and randomly chosen) samples. Analyze these data using the appropriate non-parametric hypothesis testarrow_forwardeach column represents before & after measurements on the same individual. Analyze with the appropriate non-parametric hypothesis test for a paired design.arrow_forwardShould you be confident in applying your regression equation to estimate the heart rate of a python at 35°C? Why or why not?arrow_forward
 Big Ideas Math A Bridge To Success Algebra 1: Stu...AlgebraISBN:9781680331141Author:HOUGHTON MIFFLIN HARCOURTPublisher:Houghton Mifflin Harcourt
 Holt Mcdougal Larson Pre-algebra: Student Edition...AlgebraISBN:9780547587776Author:HOLT MCDOUGALPublisher:HOLT MCDOUGAL
 Glencoe Algebra 1, Student Edition, 9780079039897...AlgebraISBN:9780079039897Author:CarterPublisher:McGraw Hill
 College Algebra (MindTap Course List)AlgebraISBN:9781305652231Author:R. David Gustafson, Jeff HughesPublisher:Cengage Learning