
MyLab Statistics with Pearson eText -- Standalone Access Card -- for Elementary Statistics
13th Edition
ISBN: 9780134748535
Author: Mario F. Triola
Publisher: PEARSON
expand_more
expand_more
format_list_bulleted
Videos
Textbook Question
Chapter 13, Problem 3CRE
In Exercises 1–3, use the data listed below. The values are departure delay times (minutes) for American Airlines flights from New York to Los Angeles. Negative values correspond to flights that departed early.
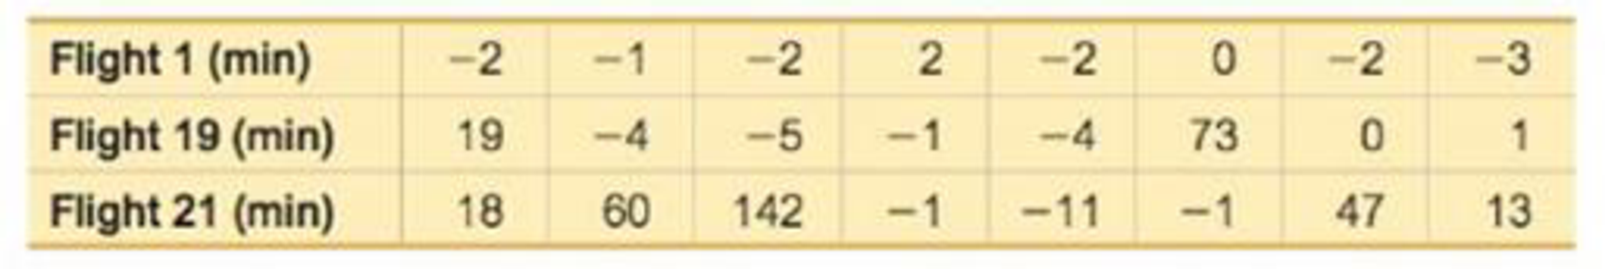
3. Departure Delay Times Use a nonparametric test to test the claim that the three samples are from populations with the same
Expert Solution & Answer
Want to see the full answer?
Check out a sample textbook solution
Students have asked these similar questions
What would you say about a set of quantitative bivariate data whose linear correlation is -1? What would a scatter diagram of the data look like? (5 points)
Business discuss
Analyze the residuals of a linear regression model and select the best response.
yes, the residual plot does not show a curve
no, the residual plot shows a curve
yes, the residual plot shows a curve
no, the residual plot does not show a curve
I answered, "No, the residual plot shows a curve." (and this was incorrect). I am not sure why I keep getting these wrong when the answer seems obvious. Please help me understand what the yes and no references in the answer.
Chapter 13 Solutions
MyLab Statistics with Pearson eText -- Standalone Access Card -- for Elementary Statistics
Ch. 13.2 - Prob. 1BSCCh. 13.2 - Prob. 2BSCCh. 13.2 - Contradicting H1 An important step in conducting...Ch. 13.2 - Efficiency of the Sign Test Refer to Table 13-2 on...Ch. 13.2 - Matched Pairs. In Exercises 58, use the sign test...Ch. 13.2 - Matched Pairs. In Exercises 58, use the sign test...Ch. 13.2 - Matched Pairs. In Exercises 58, use the sign test...Ch. 13.2 - Matched Pairs. In Exercises 58, use the sign test...Ch. 13.2 - Nominal Data. In Exercises 912, use the sign test...Ch. 13.2 - Nominal Data. In Exercises 912, use the sign test...
Ch. 13.2 - Nominal Data. In Exercises 912, use the sign test...Ch. 13.2 - Nominal Data. In Exercises 912, use the sign test...Ch. 13.2 - Appendix B Data Sets. In Exercises 1316, refer to...Ch. 13.2 - Appendix B Data Sets. In Exercises 1316, refer to...Ch. 13.2 - Appendix B Data Sets. In Exercises 1316, refer to...Ch. 13.2 - Appendix B Data Sets. In Exercises 1316, refer to...Ch. 13.2 - Procedures for Handling Ties In the sign lest...Ch. 13.2 - Finding Critical Values Table A-7 lists critical...Ch. 13.3 - Wilcoxon Signed-Ranks Test for Body Temperatures...Ch. 13.3 - Prob. 2BSCCh. 13.3 - Prob. 3BSCCh. 13.3 - Prob. 4BSCCh. 13.3 - Using the Wilcoxon Signed-Ranks Test. In Exercises...Ch. 13.3 - Using the Wilcoxon Signed-Ranks Test. In Exercises...Ch. 13.3 - Using the Wilcoxon Signed-Ranks Test. In Exercises...Ch. 13.3 - Using the Wilcoxon Signed-Ranks Test. In Exercises...Ch. 13.3 - Prob. 9BSCCh. 13.3 - Prob. 10BSCCh. 13.3 - Prob. 11BSCCh. 13.3 - Prob. 12BSCCh. 13.3 - Rank Sums Exercise 12 uses Data Set 23 Old...Ch. 13.4 - Prob. 1BSCCh. 13.4 - Rank Sum After ranking the combined list of...Ch. 13.4 - Prob. 3BSCCh. 13.4 - Prob. 4BSCCh. 13.4 - Wilcoxon Rank-Sum Test. In Exercises 58, use the...Ch. 13.4 - Wilcoxon Rank-Sum Test. In Exercises 58, use the...Ch. 13.4 - Wilcoxon Rank-Sum Test. In Exercises 58, use the...Ch. 13.4 - Wilcoxon Rank-Sum Test. In Exercises 58, use the...Ch. 13.4 - Prob. 9BSCCh. 13.4 - Appendix B Data Sets. In Exercises 912, refer to...Ch. 13.4 - Appendix B Data Sets. In Exercises 912, refer to...Ch. 13.4 - Appendix B Data Sets. In Exercises 912, refer to...Ch. 13.4 - Prob. 13BBCh. 13.4 - Finding Critical Values Assume that we have two...Ch. 13.5 - Prob. 1BSCCh. 13.5 - Requirements Assume that we want to use the data...Ch. 13.5 - Notation For the data given in Exercise 1,...Ch. 13.5 - Efficiency Refer to Table 13-2 on page 600 and...Ch. 13.5 - Prob. 5BSCCh. 13.5 - Prob. 6BSCCh. 13.5 - Prob. 7BSCCh. 13.5 - Prob. 8BSCCh. 13.5 - Appendix B Data Sets. In Exercises 912, use the...Ch. 13.5 - Prob. 10BSCCh. 13.5 - Appendix B Data Sets. In Exercises 912, use the...Ch. 13.5 - Appendix B Data Sets. In Exercises 912, use the...Ch. 13.5 - Correcting the H Test Statistic for Ties In using...Ch. 13.6 - Regression If the methods of this section are used...Ch. 13.6 - Level of Measurement Which of the levels of...Ch. 13.6 - Notation What do r, rs , and ps denote? Why is the...Ch. 13.6 - Prob. 4BSCCh. 13.6 - In Exercises 5 and 6, use the scatterplot to find...Ch. 13.6 - In Exercises 5 and 6, use the scatterplot to find...Ch. 13.6 - Testing for Rank Correlation. In Exercises 712,...Ch. 13.6 - Prob. 8BSCCh. 13.6 - Testing for Rank Correlation. In Exercises 712,...Ch. 13.6 - Testing for Rank Correlation. In Exercises 712,...Ch. 13.6 - Prob. 11BSCCh. 13.6 - Testing for Rank Correlation. In Exercises 712,...Ch. 13.6 - Prob. 13BSCCh. 13.6 - Appendix B Data Sets. In Exercises 1316, use the...Ch. 13.6 - Appendix B Data Sets. In Exercises 1316, use the...Ch. 13.6 - Prob. 16BSCCh. 13.6 - Prob. 17BBCh. 13.7 - In Exercises 14, use the following sequence of...Ch. 13.7 - Prob. 2BSCCh. 13.7 - Prob. 3BSCCh. 13.7 - Prob. 4BSCCh. 13.7 - Using the Runs Test for Randomness. In Exercises...Ch. 13.7 - Prob. 6BSCCh. 13.7 - Prob. 7BSCCh. 13.7 - Using the Runs Test for Randomness. In Exercises...Ch. 13.7 - Prob. 9BSCCh. 13.7 - Prob. 10BSCCh. 13.7 - Runs Test with Large Samples. In Exercises 912,...Ch. 13.7 - Prob. 12BSCCh. 13 - Prob. 1CQQCh. 13 - Prob. 2CQQCh. 13 - Prob. 3CQQCh. 13 - Prob. 4CQQCh. 13 - Prob. 5CQQCh. 13 - Prob. 6CQQCh. 13 - Prob. 7CQQCh. 13 - Prob. 8CQQCh. 13 - Prob. 9CQQCh. 13 - Which Test? Three different judges give the same...Ch. 13 - Prob. 1RECh. 13 - Using Nonparametric Tests. In Exercises 110, use a...Ch. 13 - Prob. 3RECh. 13 - Prob. 4RECh. 13 - Prob. 5RECh. 13 - Prob. 6RECh. 13 - Using Nonparametric Tests. In Exercises 110, use a...Ch. 13 - Prob. 8RECh. 13 - Using Nonparametric Tests. In Exercises 1-10, use...Ch. 13 - Prob. 10RECh. 13 - Prob. 1CRECh. 13 - Prob. 2CRECh. 13 - In Exercises 13, use the data listed below. The...Ch. 13 - Prob. 4CRECh. 13 - Prob. 5CRECh. 13 - Prob. 6CRECh. 13 - Prob. 7CRECh. 13 - Prob. 8CRECh. 13 - Fear of Heights Among readers of a USA Today...Ch. 13 - Cell Phones and Crashes: Analyzing Newspaper...Ch. 13 - Prob. 1TPCh. 13 - Prob. 1FDD
Knowledge Booster


Learn more about
Need a deep-dive on the concept behind this application? Look no further. Learn more about this topic, statistics and related others by exploring similar questions and additional content below.Similar questions
- a. Find the value of A.b. Find pX(x) and py(y).c. Find pX|y(x|y) and py|X(y|x)d. Are x and y independent? Why or why not?arrow_forwardAnalyze the residuals of a linear regression model and select the best response.Criteria is simple evaluation of possible indications of an exponential model vs. linear model) no, the residual plot does not show a curve yes, the residual plot does not show a curve yes, the residual plot shows a curve no, the residual plot shows a curve I selected: yes, the residual plot shows a curve and it is INCORRECT. Can u help me understand why?arrow_forwardYou have been hired as an intern to run analyses on the data and report the results back to Sarah; the five questions that Sarah needs you to address are given below. please do it step by step on excel Does there appear to be a positive or negative relationship between price and screen size? Use a scatter plot to examine the relationship. Determine and interpret the correlation coefficient between the two variables. In your interpretation, discuss the direction of the relationship (positive, negative, or zero relationship). Also discuss the strength of the relationship. Estimate the relationship between screen size and price using a simple linear regression model and interpret the estimated coefficients. (In your interpretation, tell the dollar amount by which price will change for each unit of increase in screen size). Include the manufacturer dummy variable (Samsung=1, 0 otherwise) and estimate the relationship between screen size, price and manufacturer dummy as a multiple…arrow_forward
- Here is data with as the response variable. x y54.4 19.124.9 99.334.5 9.476.6 0.359.4 4.554.4 0.139.2 56.354 15.773.8 9-156.1 319.2Make a scatter plot of this data. Which point is an outlier? Enter as an ordered pair, e.g., (x,y). (x,y)= Find the regression equation for the data set without the outlier. Enter the equation of the form mx+b rounded to three decimal places. y_wo= Find the regression equation for the data set with the outlier. Enter the equation of the form mx+b rounded to three decimal places. y_w=arrow_forwardYou have been hired as an intern to run analyses on the data and report the results back to Sarah; the five questions that Sarah needs you to address are given below. please do it step by step Does there appear to be a positive or negative relationship between price and screen size? Use a scatter plot to examine the relationship. Determine and interpret the correlation coefficient between the two variables. In your interpretation, discuss the direction of the relationship (positive, negative, or zero relationship). Also discuss the strength of the relationship. Estimate the relationship between screen size and price using a simple linear regression model and interpret the estimated coefficients. (In your interpretation, tell the dollar amount by which price will change for each unit of increase in screen size). Include the manufacturer dummy variable (Samsung=1, 0 otherwise) and estimate the relationship between screen size, price and manufacturer dummy as a multiple linear…arrow_forwardExercises: Find all the whole number solutions of the congruence equation. 1. 3x 8 mod 11 2. 2x+3= 8 mod 12 3. 3x+12= 7 mod 10 4. 4x+6= 5 mod 8 5. 5x+3= 8 mod 12arrow_forward
- Scenario Sales of products by color follow a peculiar, but predictable, pattern that determines how many units will sell in any given year. This pattern is shown below Product Color 1995 1996 1997 Red 28 42 21 1998 23 1999 29 2000 2001 2002 Unit Sales 2003 2004 15 8 4 2 1 2005 2006 discontinued Green 26 39 20 22 28 14 7 4 2 White 43 65 33 36 45 23 12 Brown 58 87 44 48 60 Yellow 37 56 28 31 Black 28 42 21 Orange 19 29 Purple Total 28 42 21 49 68 78 95 123 176 181 164 127 24 179 Questions A) Which color will sell the most units in 2007? B) Which color will sell the most units combined in the 2007 to 2009 period? Please show all your analysis, leave formulas in cells, and specify any assumptions you make.arrow_forwardOne hundred students were surveyed about their preference between dogs and cats. The following two-way table displays data for the sample of students who responded to the survey. Preference Male Female TOTAL Prefers dogs \[36\] \[20\] \[56\] Prefers cats \[10\] \[26\] \[36\] No preference \[2\] \[6\] \[8\] TOTAL \[48\] \[52\] \[100\] problem 1 Find the probability that a randomly selected student prefers dogs.Enter your answer as a fraction or decimal. \[P\left(\text{prefers dogs}\right)=\] Incorrect Check Hide explanation Preference Male Female TOTAL Prefers dogs \[\blueD{36}\] \[\blueD{20}\] \[\blueE{56}\] Prefers cats \[10\] \[26\] \[36\] No preference \[2\] \[6\] \[8\] TOTAL \[48\] \[52\] \[100\] There were \[\blueE{56}\] students in the sample who preferred dogs out of \[100\] total students.arrow_forwardBusiness discussarrow_forward
- You have been hired as an intern to run analyses on the data and report the results back to Sarah; the five questions that Sarah needs you to address are given below. Does there appear to be a positive or negative relationship between price and screen size? Use a scatter plot to examine the relationship. Determine and interpret the correlation coefficient between the two variables. In your interpretation, discuss the direction of the relationship (positive, negative, or zero relationship). Also discuss the strength of the relationship. Estimate the relationship between screen size and price using a simple linear regression model and interpret the estimated coefficients. (In your interpretation, tell the dollar amount by which price will change for each unit of increase in screen size). Include the manufacturer dummy variable (Samsung=1, 0 otherwise) and estimate the relationship between screen size, price and manufacturer dummy as a multiple linear regression model. Interpret the…arrow_forwardDoes there appear to be a positive or negative relationship between price and screen size? Use a scatter plot to examine the relationship. How to take snapshots: if you use a MacBook, press Command+ Shift+4 to take snapshots. If you are using Windows, use the Snipping Tool to take snapshots. Question 1: Determine and interpret the correlation coefficient between the two variables. In your interpretation, discuss the direction of the relationship (positive, negative, or zero relationship). Also discuss the strength of the relationship. Value of correlation coefficient: Direction of the relationship (positive, negative, or zero relationship): Strength of the relationship (strong/moderate/weak): Question 2: Estimate the relationship between screen size and price using a simple linear regression model and interpret the estimated coefficients. In your interpretation, tell the dollar amount by which price will change for each unit of increase in screen size. (The answer for the…arrow_forwardIn this problem, we consider a Brownian motion (W+) t≥0. We consider a stock model (St)t>0 given (under the measure P) by d.St 0.03 St dt + 0.2 St dwt, with So 2. We assume that the interest rate is r = 0.06. The purpose of this problem is to price an option on this stock (which we name cubic put). This option is European-type, with maturity 3 months (i.e. T = 0.25 years), and payoff given by F = (8-5)+ (a) Write the Stochastic Differential Equation satisfied by (St) under the risk-neutral measure Q. (You don't need to prove it, simply give the answer.) (b) Give the price of a regular European put on (St) with maturity 3 months and strike K = 2. (c) Let X = S. Find the Stochastic Differential Equation satisfied by the process (Xt) under the measure Q. (d) Find an explicit expression for X₁ = S3 under measure Q. (e) Using the results above, find the price of the cubic put option mentioned above. (f) Is the price in (e) the same as in question (b)? (Explain why.)arrow_forward
arrow_back_ios
SEE MORE QUESTIONS
arrow_forward_ios
Recommended textbooks for you
 Glencoe Algebra 1, Student Edition, 9780079039897...AlgebraISBN:9780079039897Author:CarterPublisher:McGraw Hill
 Big Ideas Math A Bridge To Success Algebra 1: Stu...AlgebraISBN:9781680331141Author:HOUGHTON MIFFLIN HARCOURTPublisher:Houghton Mifflin Harcourt
 Holt Mcdougal Larson Pre-algebra: Student Edition...AlgebraISBN:9780547587776Author:HOLT MCDOUGALPublisher:HOLT MCDOUGAL
Glencoe Algebra 1, Student Edition, 9780079039897...
Algebra
ISBN:9780079039897
Author:Carter
Publisher:McGraw Hill
Big Ideas Math A Bridge To Success Algebra 1: Stu...
Algebra
ISBN:9781680331141
Author:HOUGHTON MIFFLIN HARCOURT
Publisher:Houghton Mifflin Harcourt
Holt Mcdougal Larson Pre-algebra: Student Edition...
Algebra
ISBN:9780547587776
Author:HOLT MCDOUGAL
Publisher:HOLT MCDOUGAL
F- Test or F- statistic (F- Test of Equality of Variance); Author: Prof. Arvind Kumar Sing;https://www.youtube.com/watch?v=PdUt7InTyc8;License: Standard Youtube License
Statistics 101: F-ratio Test for Two Equal Variances; Author: Brandon Foltz;https://www.youtube.com/watch?v=UWQO4gX7-lE;License: Standard YouTube License, CC-BY
Hypothesis Testing and Confidence Intervals (FRM Part 1 – Book 2 – Chapter 5); Author: Analystprep;https://www.youtube.com/watch?v=vth3yZIUlGQ;License: Standard YouTube License, CC-BY
Understanding the Levene's Test for Equality of Variances in SPSS; Author: Dr. Todd Grande;https://www.youtube.com/watch?v=udJr8V2P8Xo;License: Standard Youtube License