
Concept explainers
Videos
In a completely randomized experimental design, three brands of paper towels were tested for their ability to absorb water. Equal-size towels were used, with four sections of towels tested per brand. The absorbency rating data follow. At a .05 level of significance, does there appear to be a difference in the ability of the brands to absorb water?

Check whether there is a significant difference in the ability of the brands to absorb water at
Answer to Problem 34SE
Yes, there is a significant difference in the ability of the brands to absorb water.
Explanation of Solution
Calculation:
The data represent the absorbency rate for the three brands.
Assume that
The test hypotheses are given below:
Null hypothesis:
Alternative hypothesis:
It is given that the level of significance as 0.05.
One-way ANOVA:
Software procedure:
Step-by-step procedure to obtain one-way ANOVA using EXCEL:
- Open the EXCEL.
- Enter x, y, and z in different columns.
- On Data tab in analysis group, click Data Analysis.
- Select Anova: Single Factor.
- Click OK.
- Click in the Input Range box, select x, y, and z.
- Click OK.
The output obtained using EXCEL software is shown below:
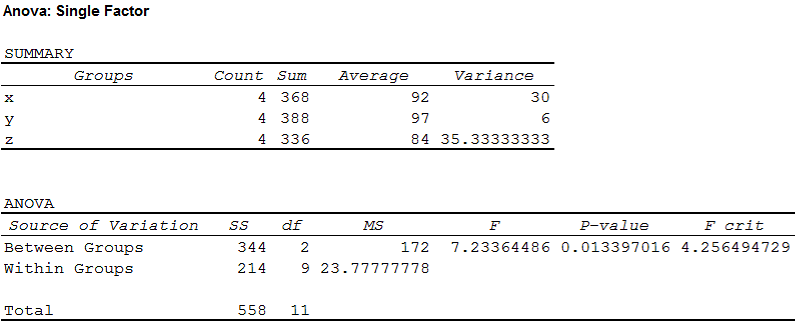
From the output, it is observed that the F-ratio is 7.23 and the p-value is 0.0134.
Decision:
If the
If the
Conclusion:
Here, the p-value is less than the level of significance.
That is,
Therefore, the null hypothesis is rejected.
Hence, there is sufficient evidence to infer that there is a significant difference in the ability of the brands to absorb water.
Want to see more full solutions like this?
Chapter 13 Solutions
Modern Business Statistics with Microsoft Office Excel (with XLSTAT Education Edition Printed Access Card)


- I need help with this problem and an explanation of the solution for the image described below. (Statistics: Engineering Probabilities)arrow_forward310015 K Question 9, 5.2.28-T Part 1 of 4 HW Score: 85.96%, 49 of 57 points Points: 1 Save of 6 Based on a poll, among adults who regret getting tattoos, 28% say that they were too young when they got their tattoos. Assume that six adults who regret getting tattoos are randomly selected, and find the indicated probability. Complete parts (a) through (d) below. a. Find the probability that none of the selected adults say that they were too young to get tattoos. 0.0520 (Round to four decimal places as needed.) Clear all Final check Feb 7 12:47 US Oarrow_forwardhow could the bar graph have been organized differently to make it easier to compare opinion changes within political partiesarrow_forward
- 30. An individual who has automobile insurance from a certain company is randomly selected. Let Y be the num- ber of moving violations for which the individual was cited during the last 3 years. The pmf of Y isy | 1 2 4 8 16p(y) | .05 .10 .35 .40 .10 a.Compute E(Y).b. Suppose an individual with Y violations incurs a surcharge of $100Y^2. Calculate the expected amount of the surcharge.arrow_forward24. An insurance company offers its policyholders a num- ber of different premium payment options. For a ran- domly selected policyholder, let X = the number of months between successive payments. The cdf of X is as follows: F(x)=0.00 : x < 10.30 : 1≤x<30.40 : 3≤ x < 40.45 : 4≤ x <60.60 : 6≤ x < 121.00 : 12≤ x a. What is the pmf of X?b. Using just the cdf, compute P(3≤ X ≤6) and P(4≤ X).arrow_forward59. At a certain gas station, 40% of the customers use regular gas (A1), 35% use plus gas (A2), and 25% use premium (A3). Of those customers using regular gas, only 30% fill their tanks (event B). Of those customers using plus, 60% fill their tanks, whereas of those using premium, 50% fill their tanks.a. What is the probability that the next customer will request plus gas and fill the tank (A2 B)?b. What is the probability that the next customer fills the tank?c. If the next customer fills the tank, what is the probability that regular gas is requested? Plus? Premium?arrow_forward
- 38. Possible values of X, the number of components in a system submitted for repair that must be replaced, are 1, 2, 3, and 4 with corresponding probabilities .15, .35, .35, and .15, respectively. a. Calculate E(X) and then E(5 - X).b. Would the repair facility be better off charging a flat fee of $75 or else the amount $[150/(5 - X)]? [Note: It is not generally true that E(c/Y) = c/E(Y).]arrow_forward74. The proportions of blood phenotypes in the U.S. popula- tion are as follows:A B AB O .40 .11 .04 .45 Assuming that the phenotypes of two randomly selected individuals are independent of one another, what is the probability that both phenotypes are O? What is the probability that the phenotypes of two randomly selected individuals match?arrow_forward53. A certain shop repairs both audio and video compo- nents. Let A denote the event that the next component brought in for repair is an audio component, and let B be the event that the next component is a compact disc player (so the event B is contained in A). Suppose that P(A) = .6 and P(B) = .05. What is P(BA)?arrow_forward
 Glencoe Algebra 1, Student Edition, 9780079039897...AlgebraISBN:9780079039897Author:CarterPublisher:McGraw Hill