Concept explainers
Happiness Are women happier than men? A StatCrunch survey asked respondents to select a number from 1 (lowest) to 100 (highest) to measure their level of happiness. The sample
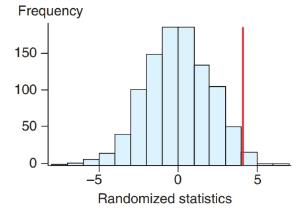
a. The histogram shows the results of 1000 randomizations of the data. In each randomization, 297 observations from the combined data were randomly marked “female,” and the rest were randomly marked “male.” We calculated the mean difference in happiness between these two randomly determined groups. Note that the distribution is centered at about 0, just as it should be, since we carried out the randomization in such a way that the null hypothesis is true. The red line shows the observed sample mean difference in happiness for the women minus the happiness for the men. From the graph, does it look like the observed mean difference is unusual for this data set? Explain.


b. The software output estimates the
c. State the
d. Using a significance level of 0.05, can we reject the null hypothesis that the means are equal and so conclude that women StatCrunch users tend to be happier than men StatCrunch users? (Assume the sample was randomly selected from the population of all StatCrunch users.)
(Source: StatCrunch: Responses to Happiness survey. Owner: Webster West)
Want to see the full answer?
Check out a sample textbook solution
Chapter 13 Solutions
EP INTRODUCTORY STATISTICS-MYSTATLAB
Additional Math Textbook Solutions
Elementary Statistics: Picturing the World (7th Edition)
Elementary & Intermediate Algebra
Intermediate Algebra (13th Edition)
A First Course in Probability (10th Edition)
A Problem Solving Approach To Mathematics For Elementary School Teachers (13th Edition)
- AP1.2 A child is 40 inches tall, which places her at the 90th percentile of all children of similar age. The heights for children of this age form an approximately Normal distribution with a mean of 38 inches. Based on this information, what is the standard deviation of the heights of all children of this age? 0.20 inches (c) 0.65 inches (e) 1.56 inches 0.31 inches (d) 1.21 inchesarrow_forwardAP1.1 You look at real estate ads for houses in Sarasota, Florida. Many houses range from $200,000 to $400,000 in price. The few houses on the water, however, have prices up to $15 million. Which of the following statements best describes the distribution of home prices in Sarasota? The distribution is most likely skewed to the left, and the mean is greater than the median. The distribution is most likely skewed to the left, and the mean is less than the median. The distribution is roughly symmetric with a few high outliers, and the mean is approximately equal to the median. The distribution is most likely skewed to the right, and the mean is greater than the median. The distribution is most likely skewed to the right, and the mean is less than the median.arrow_forwardDuring busy political seasons, many opinion polls are conducted. In apresidential race, how do you think the participants in polls are generally selected?Discuss any issues regarding simple random, stratified, systematic, cluster, andconvenience sampling in these polls. What about other types of polls, besides political?arrow_forward
- Please could you explain why 0.5 was added to each upper limpit of the intervals.Thanksarrow_forward28. (a) Under what conditions do we say that two random variables X and Y are independent? (b) Demonstrate that if X and Y are independent, then it follows that E(XY) = E(X)E(Y); (e) Show by a counter example that the converse of (ii) is not necessarily true.arrow_forward1. Let X and Y be random variables and suppose that A = F. Prove that Z XI(A)+YI(A) is a random variable.arrow_forward
 Holt Mcdougal Larson Pre-algebra: Student Edition...AlgebraISBN:9780547587776Author:HOLT MCDOUGALPublisher:HOLT MCDOUGAL
 Big Ideas Math A Bridge To Success Algebra 1: Stu...AlgebraISBN:9781680331141Author:HOUGHTON MIFFLIN HARCOURTPublisher:Houghton Mifflin Harcourt
 College Algebra (MindTap Course List)AlgebraISBN:9781305652231Author:R. David Gustafson, Jeff HughesPublisher:Cengage Learning
 Glencoe Algebra 1, Student Edition, 9780079039897...AlgebraISBN:9780079039897Author:CarterPublisher:McGraw Hill


