Foundations of Financial Management
16th Edition
ISBN: 9781259277160
Author: Stanley B. Block, Geoffrey A. Hirt, Bartley Danielsen
Publisher: McGraw-Hill Education
expand_more
expand_more
format_list_bulleted
Concept explainers
Textbook Question
Chapter 13, Problem 24P
Ms. Sharp is looking at a number of different types of investments for her portfolio. She identifies eight possible investments.

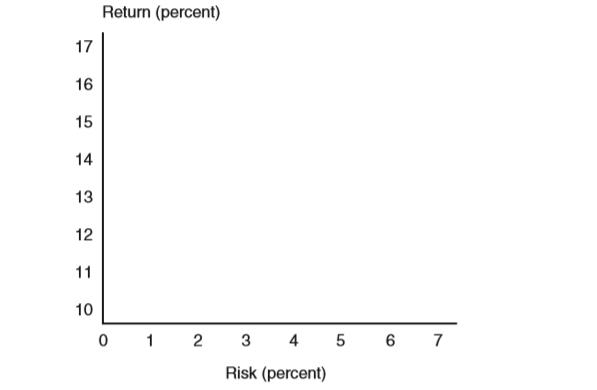
a. Graph the data in a manner similar to Figure 13-10. Use the following axes for your data:

b. Draw a
c. What two objectives do points on the efficient frontier satisfy?
d. Is there one point on the efficient frontier that is best for all investors?
Expert Solution & Answer
Want to see the full answer?
Check out a sample textbook solution
Students have asked these similar questions
Answer this question Using the Google drive liink below it hhas the case study
In the scenario, Sharp’s employer has been putting more emphasis on controlling costsfor the various businesses. With the slowing of overall spending in the construction sector,Travolta had ordered managers to closely monitor expenses. He had sold several companiesand has given vice presidents greater responsibility for statements of financial positions. Whatpositive and negative consequences might this pose to the company in future fraud prevention?Outline at least three of each type. Please use sources and insert intext citiations Apa 7 format in the answer and provide the links and references below.
https://docs.google.com/document/d/1MpthrFl3eAnMKR-EprYRP9sMo8Ll0WtbhxhpGtLbdcw/edit?usp=sharing
file:///C:/Users/rafan/Downloads/Assignment%201%20Paving%20Company%20Case%20S2%202024%20to%202025.pdf
Using the link for the fraud case answer only this question below.
b) As discussed in units 1 to 4, all frauds involve key elements. Identify and describe usingexamples, the elements of Sharp’s fraud.
Option should be match
experts are giving incorrect answer they are using AI /Chatgpt that is generating wrong answer.
i will give unhelpful if answer will not match in option.
dont use AI also
Chapter 13 Solutions
Foundations of Financial Management
Ch. 13 - Prob. 1DQCh. 13 - Discuss the concept of risk and how it might be...Ch. 13 - When is the coefficient of variation a better...Ch. 13 - Explain how the concept of risk can be...Ch. 13 - If risk is to be analyzed in a qualitative way,...Ch. 13 - Assume a company, correlated with the economy, is...Ch. 13 - Assume a firm has several hundred possible...Ch. 13 - Explain the effect of the risk-return trade-off on...Ch. 13 - What is the purpose of using simulation analysis?...Ch. 13 - Assume you are risk-averse and have the following...
Ch. 13 - Myers Business Systems is evaluating the...Ch. 13 - Prob. 3PCh. 13 - Prob. 4PCh. 13 - Prob. 5PCh. 13 - Possible outcomes for three investment...Ch. 13 - Prob. 7PCh. 13 - Prob. 8PCh. 13 - Prob. 9PCh. 13 - Prob. 10PCh. 13 - Prob. 12PCh. 13 - Waste Industries is evaluating a 70,000 project...Ch. 13 - Prob. 14PCh. 13 - Debby’s Dance Studios is considering the...Ch. 13 - Prob. 17PCh. 13 - Prob. 18PCh. 13 - Allison’s Dresswear Manufacturers is preparing a...Ch. 13 - Prob. 20PCh. 13 - Prob. 21PCh. 13 - Prob. 22PCh. 13 - Ms. Sharp is looking at a number of different...Ch. 13 - Prob. 25P
Knowledge Booster
Learn more about
Need a deep-dive on the concept behind this application? Look no further. Learn more about this topic, finance and related others by exploring similar questions and additional content below.Similar questions
- Option should be match. please don't use ai if option will not match means answer is incorrect . Ai giving incorrect answerarrow_forwardOption should be match. please don't use ai if option will not match means answer is incorrect . Ai giving incorrect answerarrow_forwardall frauds involve key elements. Identify and describe usingexamples the elements of fraudarrow_forward
- Solve for maturity value, discount period, bank discount, and proceeds. Assume a bank discount rate of 9%. Use the ordinary interest method. (Use Days in a year table.) Note: Do not round intermediate calculations. Round your final answers to the nearest cent. face value(principal) $50000rate interest:11%length of note: 95 days maturity value: ?date of note: june 10date note discounted: July 18discount period:?bank discount:?proceeds:?arrow_forwardWhat are the different types of audits and different types of auditors? WHat is an example of each type of audit? What is the significance of each from the perspective of different stakeholders?arrow_forwardDrill Problem 11-5 (Static) [LU 11-2 (1, 2)]Solve for maturity value, discount period, bank discount, and proceeds. Assume a bank discount rate of 9%. Use the ordinary interest method. (Use Days in a year table.) Note: Do not round intermediate calculations. Round your final answers to the nearest cent. face value(principal) $50000rate interest =11% length of note= 95 days maturity value=?date of note=june 10date note discounted= July 18discount period=?bank discount=?proceeds=?arrow_forward
- Solve for maturity value, discount period, bank discount, and proceeds. Assume a bank discount rate of 9%. Use the ordinary interest method. (Use Days in a year table.) Note: Do not round intermediate calculations. Round your final answers to the nearest cent.face value(principal) $50000rate interest =11%maturity value=?date of note =june 10date note discounted= July 18discount period=?bank discount=?proceeds=? i need an explanation I am having a lot of trouble to solve thisarrow_forwardmany experts giving wrong solAnswer should be match in options. Many experts are giving incorrect answer they are using AI /Chatgpt that is generating wrong answer. i will give unhelpful if answer will not match in option. dont use AI alsoarrow_forwardAnti-Pandemic Pharma Co. Ltd. reports the following information inits income statement:Sales = $5,250,000;Costs = $2, 173,000;Other expenses = $187,400;Depreciation expense = $79,000;Interest expense= $53,555;Taxes = $76,000;Dividends = $69,000.$136,700 worth of new shares were also issued during the year andlong-term debt worth $65,300 was redeemed.a) Compute the cash flow from assetsb) Compute the net change in working capitalarrow_forward
- Question 3 Footfall Manufacturing Ltd. reports the following financial information at the end of the current year: Net Sales $100,000 Debtor's turnover ratio (based on 2 net sales) Inventory turnover ratio 1.25 Fixed assets turnover ratio 0.8 Debt to assets ratio 0.6 Net profit margin 5% Gross profit margin 25% Return on investment 2% Use the given information to fill out the templates for income statement and balance sheet given below: Income Statement of Footfall Manufacturing Ltd. for the year ending December 31, 20XX (in $) Sales 100,000 Cost of goods sold Gross profit Other expenses Earnings before tax Tax @50% Earnings after tax Balance Sheet of Footfall Manufacturing Ltd. as at December 31, 20XX (in $) Liabilities Amount Assets Amount Equity Net fixed assets Long term 50,000 Inventory debt Short term debt Debtors Cash TOTAL TOTALarrow_forwardToodles Inc. had sales of $1,840,000. Cost of goods sold, administrative and selling expenses, and depreciation expenses were $1,180,000, $185,000 and $365,000 respectively. In addition, the company had an interest expense of $280,000 and a tax rate of 35 percent. (Ignore any tax loss carry-back or carry-forward provisions.) Arrange the financial information for Toodles Inc. in an income statement and compute its OCF? All computations must be done and shown manually. Kindly no spreadsheetcomputations. So that I am able to follow and understand clearly please.arrow_forwardJingle Ltd. and Bell Ltd. belong to the same industry. A snapshot of some of their financial information is given below: Jingle Ltd. Bell Ltd. Current ratio 3.2 1 2 1 Acid-test ratio 1.7 1 1.1 1 Debt Equity ratio 30% 40% Times interest earned 6 5 You are a loans officer and both companies have asked for an equal 2-year loan. i) ii) If you could facilitate only one loan, which company would you refuse? Explain your reasoning briefly If both companies could be facilitated, would you be willing to do so? Explain your argument briefly.arrow_forward
arrow_back_ios
SEE MORE QUESTIONS
arrow_forward_ios
Recommended textbooks for you
 Financial Reporting, Financial Statement Analysis...FinanceISBN:9781285190907Author:James M. Wahlen, Stephen P. Baginski, Mark BradshawPublisher:Cengage Learning


Financial Reporting, Financial Statement Analysis...
Finance
ISBN:9781285190907
Author:James M. Wahlen, Stephen P. Baginski, Mark Bradshaw
Publisher:Cengage Learning
Portfolio Management; Author: DevTechFinance;https://www.youtube.com/watch?v=Qmw15cG2Mv4;License: Standard YouTube License, CC-BY