
Marginal revenue curve.
Explanation of Solution
Marginal revenue curve and profit maximizing level of
Figure 1 shows profit maximizing price, quantity and
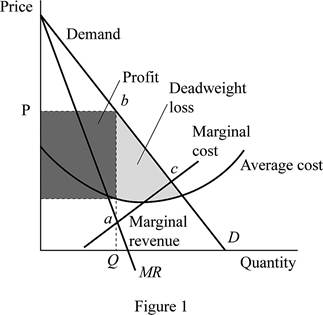
In figure 1, the vertical axis measure price and horizontal axis measure quantity. The downward sloping curve “D” is the
Concept introduction:
Marginal revenue curve: Marginal revenue curve shows the additional revenue that will be generated by increasing product sales by one unit.
Want to see more full solutions like this?
Chapter 13 Solutions
Loose-leaf Version for Modern Principles of Microeconomics 4e & SaplingPlus for Modern Principles of Microeconomics 4e (Six Months Access)

- not use ai pleasearrow_forwardNot use ai pleasearrow_forwardHelp me write these economic analysis for Macys one paragraph) Company name/current state of operation of this company - Describe the company's performance in the present economy, whether it is growing or declining, and who are its competitors?arrow_forward
- not use ai pleasearrow_forwardThe following graph plots daily cost curves for a firm operating in the competitive market for sweatbands. Hint: Once you have positioned the rectangle on the graph, select a point to observe its coordinates. Profit or Loss0246810121416182050454035302520151050PRICE (Dollars per sweatband)QUANTITY (Thousands of sweatbands per day)MCATCAVC8, 30 In the short run, given a market price equal to $15 per sweatband, the firm should produce a daily quantity of sweatbands. On the preceding graph, use the blue rectangle (circle symbols) to fill in the area that represents profit or loss of the firm given the market price of $15 and the quantity of production from your previous answer. Note: In the following question, enter a positive number regardless of whether the firm earns a profit or incurs a loss. The rectangular area represents a short-run of thousand per day for the firm.arrow_forwardNot use ai pleasearrow_forward

 Principles of Economics (12th Edition)EconomicsISBN:9780134078779Author:Karl E. Case, Ray C. Fair, Sharon E. OsterPublisher:PEARSON
 Engineering Economy (17th Edition)EconomicsISBN:9780134870069Author:William G. Sullivan, Elin M. Wicks, C. Patrick KoellingPublisher:PEARSON
 Principles of Economics (MindTap Course List)EconomicsISBN:9781305585126Author:N. Gregory MankiwPublisher:Cengage Learning
 Managerial Economics: A Problem Solving ApproachEconomicsISBN:9781337106665Author:Luke M. Froeb, Brian T. McCann, Michael R. Ward, Mike ShorPublisher:Cengage Learning
 Managerial Economics & Business Strategy (Mcgraw-...EconomicsISBN:9781259290619Author:Michael Baye, Jeff PrincePublisher:McGraw-Hill Education