Videos
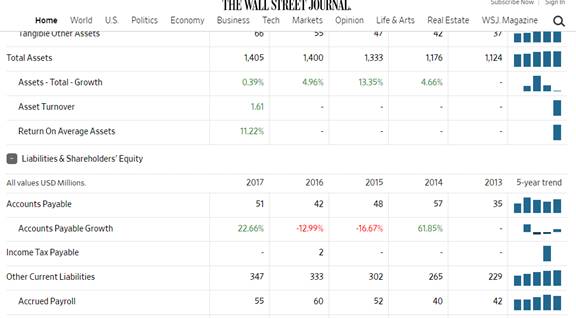
To get an overall picture of each company's capital structure, it is helpful to look at a the Key Ratios screen and then select the Financial Health tab. Common size balance sheet data are provided over a 10-year period. What, if any, are the major trends that emerge when you're looking at those data? Do those companies tend to have relatively high or relatively low levels of debt? Do these companies have significant levels of current liabilities? Have their capital structures changed over time?
Use online resources to work on this chapter's questions. Please note that website information changes over time, and these changes may limit your ability to answer some of these questions.
This chapter provides an overview of the effects of leverage and describes the process that firms use to determine their optimal capital structure. The chapter also indicates that capital structures tend to vary across industries and across countries. If you are interested in exploring these differences in more detail, the Morningstar website provides information about the capital structures of each of the companies it follows. The following discussion questions demonstrate how we can use this information to evaluate the capital structures for four restaurant companies: Cheesecake Factory (CAKE), Chipotle Mexican Grill (CMG), Ruby Tuesday (RT), and O'Charley's Inc. (CHUX).
Want to see the full answer?
Check out a sample textbook solution
Chapter 13 Solutions
Fundamentals of Financial Management, Concise Edition (MindTap Course List)


- If your Uncle borrows $60,000 from the bank at 10 percent interest over the seven-year life of the loan, what equal annual payments must be made to discharge the loan, plus pay the bank its required rate of interest? How much of his first payment will be applied to interest? To principal? How much of his second payment will be applied to each?arrow_forwardQ1: You are an analyst in charge of valuing common stocks. You have been asked to value two stocks. The first stock NEWER Inc. just paid a dividend of $6.00. The dividend is expected to increase by 60%, 45%, 30% and 15% per year, respectively, in the next four years. Thereafter, the dividend will increase by 4% per year in perpetuity. Calculate NEWER’s expected dividend for t = 1, 2, 3, 4 and 5.The required rate of return for NEWER stock is 14% compounded annually.What is NEWER’s stock price?The second stock is OLDER Inc. OLDER Inc. will pay its first dividend of $10.00 three (3) years from today. The dividend will increase by 30% per year for the following four (4) years after its first dividend payment. Thereafter, the dividend will increase by 3% per year in perpetuity. Calculate OLDER’s expected dividend for t = 1, 2, 3, 4, 5, 6, 7 and 8.The required rate of return for OLDER stock is 16% compounded annually.What is OLDER’s stock price?Now assume that both stocks have a required…arrow_forwardQ1: Blossom is 30 years old. She plans on retiring in 25 years, at the age of 55. She believes she will live until she is 105. In order to live comfortably, she needs a substantial retirement income. She wants to receive a weekly income of $5,000 during retirement. The payments will be made at the beginning of each week during her retirement. Also, Blossom has pledged to make an annual donation to her favorite charity during her retirement. The payments will be made at the end of each year. There will be a total of 50 annual payments to the charity. The first annual payment will be for $20,000. Blossom wants the annual payments to increase by 3% per year. The payments will end when she dies. In addition, she would like to establish a scholarship at Toronto Metropolitan University. The first payment would be $80,000 and would be made 3 years after she retires. Thereafter, the scholarship payments will be made every year. She wants the payments to continue after her death, therefore…arrow_forward
- Q1: Blossom is 30 years old. She plans on retiring in 25 years, at the age of 55. She believes she will live until she is 105. In order to live comfortably, she needs a substantial retirement income. She wants to receive a weekly income of $5,000 during retirement. The payments will be made at the beginning of each week during her retirement. Also, Blossom has pledged to make an annual donation to her favorite charity during her retirement. The payments will be made at the end of each year. There will be a total of 50 annual payments to the charity. The first annual payment will be for $20,000. Blossom wants the annual payments to increase by 3% per year. The payments will end when she dies. In addition, she would like to establish a scholarship at Toronto Metropolitan University. The first payment would be $80,000 and would be made 3 years after she retires. Thereafter, the scholarship payments will be made every year. She wants the payments to continue after her death, therefore…arrow_forwardJerome Moore invests in a stock that will pay dividends of $2.00 at the end of the first year; $2.20 at the end of the second year; and $2.40 at the end of the third year. also, he believes that at the end of the third year he will be able to sell the stock for $33. what is the present value of all future benefits if a discount rate of 11 percent is applied?arrow_forwardQ1: You are an analyst in charge of valuing common stocks. You have been asked to value two stocks. The first stock NEWER Inc. just paid a dividend of $6.00. The dividend is expected to increase by 60%, 45%, 30% and 15% per year, respectively, in the next four years. Thereafter, the dividend will increase by 4% per year in perpetuity. Calculate NEWER’s expected dividend for t = 1, 2, 3, 4 and 5.The required rate of return for NEWER stock is 14% compounded annually.What is NEWER’s stock price?The second stock is OLDER Inc. OLDER Inc. will pay its first dividend of $10.00 three (3) years from today. The dividend will increase by 30% per year for the following four (4) years after its first dividend payment. Thereafter, the dividend will increase by 3% per year in perpetuity. Calculate OLDER’s expected dividend for t = 1, 2, 3, 4, 5, 6, 7 and 8.The required rate of return for OLDER stock is 16% compounded annually.What is OLDER’s stock price?Now assume that both stocks have a required…arrow_forward
- Q1: You are an analyst in charge of valuing common stocks. You have been asked to value two stocks. The first stock NEWER Inc. just paid a dividend of $6.00. The dividend is expected to increase by 60%, 45%, 30% and 15% per year, respectively, in the next four years. Thereafter, the dividend will increase by 4% per year in perpetuity. Calculate NEWER’s expected dividend for t = 1, 2, 3, 4 and 5.The required rate of return for NEWER stock is 14% compounded annually.What is NEWER’s stock price?The second stock is OLDER Inc. OLDER Inc. will pay its first dividend of $10.00 three (3) years from today. The dividend will increase by 30% per year for the following four (4) years after its first dividend payment. Thereafter, the dividend will increase by 3% per year in perpetuity. Calculate OLDER’s expected dividend for t = 1, 2, 3, 4, 5, 6, 7 and 8.The required rate of return for OLDER stock is 16% compounded annually.What is OLDER’s stock price?Now assume that both stocks have a required…arrow_forwardQ1: Blossom is 30 years old. She plans on retiring in 25 years, at the age of 55. She believes she will live until she is 105. In order to live comfortably, she needs a substantial retirement income. She wants to receive a weekly income of $5,000 during retirement. The payments will be made at the beginning of each week during her retirement. Also, Blossom has pledged to make an annual donation to her favorite charity during her retirement. The payments will be made at the end of each year. There will be a total of 50 annual payments to the charity. The first annual payment will be for $20,000. Blossom wants the annual payments to increase by 3% per year. The payments will end when she dies. In addition, she would like to establish a scholarship at Toronto Metropolitan University. The first payment would be $80,000 and would be made 3 years after she retires. Thereafter, the scholarship payments will be made every year. She wants the payments to continue after her death, therefore…arrow_forwardTrue and False 1. There are no more than two separate phases to decision making and problem solving. 2. Every manager always has complete control over all inputs and factors. 3. Opportunity cost is only considered by accountants as a way to calculate profits 4. Standard error is always used to evaluate the overall strength of the regression model 5. The t-Stat is used in a similar way as the P-valued is used 6. The P-value is used as R-square is used. 7. R-square is used to evaluate the overall strength of the model. 8. Defining the problem is one of the last things that a manager considers Interpreting Regression Printouts (very brief answers) R² = .859 Intercept T N = 51 Coefficients 13.9 F= 306.5 Standard Error .139 SER=.1036 t Stat P value 99.8 0 .275 .0157 17.5 0 The above table examines the relationship between the nunber, of poor central city households in the U.S. and changes in the costs of college tuition from 1967 to 2019. 9. What is the direction of this relationship? 10.…arrow_forward
- CARS Auto Co. Ltd – Alpha Branch Unadjusted Trial Balance December 31, 2024 A/C NAME TRIAL BALANCE DR CR cash 240,000 Accounts receivables 120,000 supplies 41,100 Lease hold improvement 200,000 Accumulated depreciation – Lease hold improvement 80,000 Furniture and fixtures 800,000 Accumulated depreciation - furniture and fixtures 380,000 Accounts payable 30,000 Salary payable Unearned service revenue 44,100 Cars, capital 649,000 Cars, withdrawal 165,100 Service revenue 450,000 Salary expense 48,400 Supplies expense Rent expense Depreciation expense – leasehold improvement Depreciation expense – furniture and fixtures Advertising expense 18,500 1,633,100 1,633,100 Data presented for the adjusting entries include the following: Rent expense of $160,000…arrow_forwardScenario: Jim played football for a famous club but, due to a long term injury and on medical advice, he retired from the game in January 2007. The club, grateful for Jim’s contribution to their success over the years, held a testimonial match in Jim’s honour. Jim received €150,000 from this testimonial match and he decided to open a shop selling sporting goods with the proceeds. On 1 May 2007, Jim opened a business bank account into which he paid the €150,000. In the first year of trading, he undertook the following transactions: 2 May 2007: Jim signed a five year lease on a shop in the town centre and paid €50,000 to cover the lease for the whole five years 3 May 2007: Jim paid shop fitters €10,000 for shelves and racking and for the electronic till in which to record sales. Jim expects these assets will also have a useful life of 5 years. He hired a part time assistant at a cost of €250 per month paid monthly by cheque from the business bank account. While his main business is to…arrow_forwardHelp with questions 7-24arrow_forward
 Fundamentals of Financial Management, Concise Edi...FinanceISBN:9781305635937Author:Eugene F. Brigham, Joel F. HoustonPublisher:Cengage Learning
 Fundamentals of Financial Management, Concise Edi...FinanceISBN:9781285065137Author:Eugene F. Brigham, Joel F. HoustonPublisher:Cengage Learning
 EBK CONTEMPORARY FINANCIAL MANAGEMENTFinanceISBN:9781337514835Author:MOYERPublisher:CENGAGE LEARNING - CONSIGNMENT
 Intermediate Financial Management (MindTap Course...FinanceISBN:9781337395083Author:Eugene F. Brigham, Phillip R. DavesPublisher:Cengage Learning
 Century 21 Accounting Multicolumn JournalAccountingISBN:9781337679503Author:GilbertsonPublisher:Cengage