Concept explainers
Reminder Round all answers to two decimal places unless otherwise indicated.
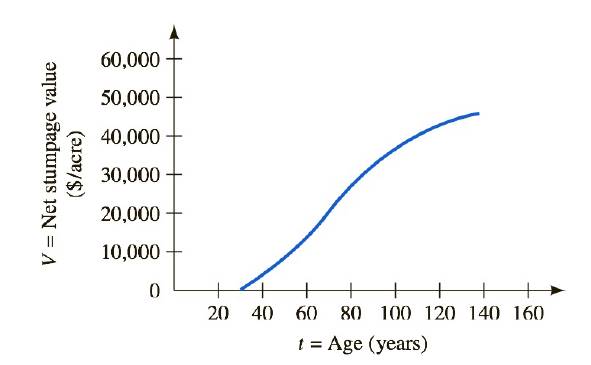
Cutting Trees In forestry management, it is important to know the net stumpage value of a stand (that is, a group) of trees. This is the commercial value of the trees minus the costs of felling, hauling, etc. The graph in Figure


FIGURE
a. Estimate the net stumpage value of a Douglas fir 1 stand that is
b. Estimate the age of a Douglas fir stand whose net stumpage value is
c. At what age does the commercial value of the stand equal the costs of felling, hauling, etc.?
d. At what age is the net stumpage value increasing the fastest?
e. This graph shows V only up to age
Trending nowThis is a popular solution!

Chapter 1 Solutions
Functions and Change: A Modeling Approach to College Algebra (MindTap Course List)
Additional Math Textbook Solutions
Elementary Statistics
Finite Mathematics for Business, Economics, Life Sciences and Social Sciences
Elementary & Intermediate Algebra
Precalculus: Mathematics for Calculus (Standalone Book)
Intro Stats, Books a la Carte Edition (5th Edition)
Elementary Statistics Using The Ti-83/84 Plus Calculator, Books A La Carte Edition (5th Edition)
- Use the graph to solve 3x2-3x-8=0arrow_forwardÎntr-un bloc sunt apartamente cu 2 camere și apartamente cu 3 camere , în total 20 de apartamente și 45 de camere.Calculați câte apartamente sunt cu 2 camere și câte apartamente sunt cu 3 camere.arrow_forward1.2.19. Let and s be natural numbers. Let G be the simple graph with vertex set Vo... V„−1 such that v; ↔ v; if and only if |ji| Є (r,s). Prove that S has exactly k components, where k is the greatest common divisor of {n, r,s}.arrow_forward
- Question 3 over a field K. In this question, MË(K) denotes the set of n × n matrices (a) Suppose that A Є Mn(K) is an invertible matrix. Is it always true that A is equivalent to A-¹? Justify your answer. (b) Let B be given by 8 B = 0 7 7 0 -7 7 Working over the field F2 with 2 elements, compute the rank of B as an element of M2(F2). (c) Let 1 C -1 1 [4] [6] and consider C as an element of M3(Q). Determine the minimal polynomial mc(x) and hence, or otherwise, show that C can not be diagonalised. [7] (d) Show that C in (c) considered as an element of M3(R) can be diagonalised. Write down all the eigenvalues. Show your working. [8]arrow_forwardR denotes the field of real numbers, Q denotes the field of rationals, and Fp denotes the field of p elements given by integers modulo p. You may refer to general results from lectures. Question 1 For each non-negative integer m, let R[x]m denote the vector space consisting of the polynomials in x with coefficients in R and of degree ≤ m. x²+2, V3 = 5. Prove that (V1, V2, V3) is a linearly independent (a) Let vi = x, V2 = list in R[x] 3. (b) Let V1, V2, V3 be as defined in (a). Find a vector v € R[×]3 such that (V1, V2, V3, V4) is a basis of R[x] 3. [8] [6] (c) Prove that the map ƒ from R[x] 2 to R[x]3 given by f(p(x)) = xp(x) — xp(0) is a linear map. [6] (d) Write down the matrix for the map ƒ defined in (c) with respect to the basis (2,2x + 1, x²) of R[x] 2 and the basis (1, x, x², x³) of R[x] 3. [5]arrow_forwardQuestion 4 (a) The following matrices represent linear maps on R² with respect to an orthonormal basis: = [1/√5 2/√5 [2/√5 -1/√5] " [1/√5 2/√5] A = B = [2/√5 1/√5] 1 C = D = = = [ 1/3/5 2/35] 1/√5 2/√5 -2/√5 1/√5' For each of the matrices A, B, C, D, state whether it represents a self-adjoint linear map, an orthogonal linear map, both, or neither. (b) For the quadratic form q(x, y, z) = y² + 2xy +2yz over R, write down a linear change of variables to u, v, w such that q in these terms is in canonical form for Sylvester's Law of Inertia. [6] [4]arrow_forward
- part b pleasearrow_forwardQuestion 5 (a) Let a, b, c, d, e, ƒ Є K where K is a field. Suppose that the determinant of the matrix a cl |df equals 3 and the determinant of determinant of the matrix a+3b cl d+3e f ГЪ e [ c ] equals 2. Compute the [5] (b) Calculate the adjugate Adj (A) of the 2 × 2 matrix [1 2 A = over R. (c) Working over the field F3 with 3 elements, use row and column operations to put the matrix [6] 0123] A = 3210 into canonical form for equivalence and write down the canonical form. What is the rank of A as a matrix over F3? 4arrow_forwardQuestion 2 In this question, V = Q4 and - U = {(x, y, z, w) EV | x+y2w+ z = 0}, W = {(x, y, z, w) € V | x − 2y + w − z = 0}, Z = {(x, y, z, w) € V | xyzw = 0}. (a) Determine which of U, W, Z are subspaces of V. Justify your answers. (b) Show that UW is a subspace of V and determine its dimension. (c) Is VU+W? Is V = UW? Justify your answers. [10] [7] '00'arrow_forward
- Tools Sign in Different masses and Indicated velocities Rotational inert > C C Chegg 39. The balls shown have different masses and speeds. Rank the following from greatest to least: 2.0 m/s 8.5 m/s 9.0 m/s 12.0 m/s 1.0 kg A 1.2 kg B 0.8 kg C 5.0 kg D C a. The momenta b. The impulses needed to stop the balls Solved 39. The balls shown have different masses and speeds. | Chegg.com Images may be subject to copyright. Learn More Share H Save Visit > quizlet.com%2FBoyE3qwOAUqXvw95Fgh5Rw.jpg&imgrefurl=https%3A%2F%2Fquizlet.com%2F529359992%2Fc. Xarrow_forwardSimplify the below expression. 3 - (-7)arrow_forward(6) ≤ a) Determine the following groups: Homz(Q, Z), Homz(Q, Q), Homz(Q/Z, Z) for n E N. Homz(Z/nZ, Q) b) Show for ME MR: HomR (R, M) = M.arrow_forward
 Big Ideas Math A Bridge To Success Algebra 1: Stu...AlgebraISBN:9781680331141Author:HOUGHTON MIFFLIN HARCOURTPublisher:Houghton Mifflin Harcourt
 Algebra and Trigonometry (MindTap Course List)AlgebraISBN:9781305071742Author:James Stewart, Lothar Redlin, Saleem WatsonPublisher:Cengage Learning
 Trigonometry (MindTap Course List)TrigonometryISBN:9781337278461Author:Ron LarsonPublisher:Cengage Learning
- Algebra & Trigonometry with Analytic GeometryAlgebraISBN:9781133382119Author:SwokowskiPublisher:Cengage
 College Algebra (MindTap Course List)AlgebraISBN:9781305652231Author:R. David Gustafson, Jeff HughesPublisher:Cengage Learning
 College AlgebraAlgebraISBN:9781305115545Author:James Stewart, Lothar Redlin, Saleem WatsonPublisher:Cengage Learning


