
Statistics for Engineers and Scientists
4th Edition
ISBN: 9780073401331
Author: William Navidi Prof.
Publisher: McGraw-Hill Education
expand_more
expand_more
format_list_bulleted
Concept explainers
Videos
Textbook Question
Chapter 1.3, Problem 14E
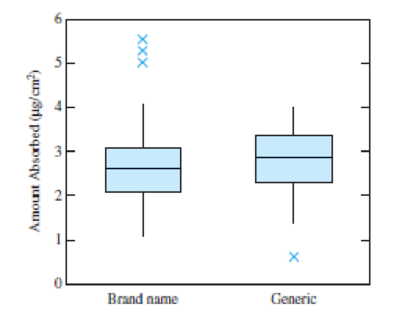
Following are boxplots comparing the amount of econozole nitrate (in µg/cm2) absorbed into skin for a brand name and a generic antifungal ointment (from the article "Improved Bioequivalence Assessment of Topical Dermatological Drug Products Using Dermatopharmacokinetics.” B. N’Dri-Stempfer, W. Navidi, R. Guy, and A. Bunge, Pharmaceutical Research, 2009:316–328).
True or false:
- a. The
median amount absorbed for the brand name drug is greater than the 25th percentile of the amount absorbed for the generic drug. - b. The median amount absorbed for the brand name drug is greater than the median amount absorbed for the generic drug.
- c. About half the sample values for the brand name drug are between 2 and 3.
- d. There is a greater proportion of values outside the box for the brand name drug than for the generic drug.
- e. Both samples are skewed to the right.
- f. Both samples contain outliers.
Expert Solution & Answer
Want to see the full answer?
Check out a sample textbook solution
Students have asked these similar questions
«
CENGAGE MINDTAP
Quiz: Chapter 38
Assignment: Quiz: Chapter 38
ips
Questions ra1kw08h_ch38.15m
13.
14.
15.
O
Which sentence has modifiers in the correct place?
O a. When called, she for a medical emergency responds quickly.
b. Without giving away too much of the plot, Helena described the heroine's actions in the film.
O c. Nearly the snakebite victim died before the proper antitoxin was injected.
. O
O
16
16.
O
17.
18.
O
19.
O
20
20.
21
21.
22.
22
DS
23.
23
24.
25.
O
O
O
Questions ra1kw08h_ch36.14m
12.
13.
14.
15.
16.
Ӧ
17.
18.
19.
OS
20.
Two separate sentences need
Oa. two separate subjects.
Ob. two dependent clauses.
c. one shared subject.
Customers experiencing technical difficulty with their Internet cable service may call an 800 number for technical support. It takes the technician between 30 seconds and 11 minutes to resolve the problem. The distribution of this support time follows the uniform distribution.
Required:
a. What are the values for a and b in minutes?
Note: Do not round your intermediate calculations. Round your answers to 1 decimal place.
b-1. What is the mean time to resolve the problem?
b-2. What is the standard deviation of the time?
c. What percent of the problems take more than 5 minutes to resolve?
d. Suppose we wish to find the middle 50% of the problem-solving times. What are the end points of these two times?
Chapter 1 Solutions
Statistics for Engineers and Scientists
Ch. 1.1 - Each of the following processes involves sampling...Ch. 1.1 - If you wanted to estimate the mean height of all...Ch. 1.1 - True or false: a. A simple random sample is...Ch. 1.1 - A sample of 100 college students is selected from...Ch. 1.1 - A certain process for manufacturing integrated...Ch. 1.1 - Refer to Exercise 5. True or false: a. If the...Ch. 1.1 - To determine whether a sample should be treated as...Ch. 1.1 - A medical researcher wants to determine whether...Ch. 1.1 - A medical researcher wants to determine whether...Ch. 1.2 - True or false: For any list of numbers, half of...
Ch. 1.2 - Is the sample mean always the most frequently...Ch. 1.2 - Is the sample mean always equal to one of the...Ch. 1.2 - Is the sample median always equal to one of the...Ch. 1.2 - Find a sample size for which the median will...Ch. 1.2 - For a list of positive numbers, is it possible for...Ch. 1.2 - Is it possible for the standard deviation of a...Ch. 1.2 - In a certain company, every worker received a...Ch. 1.2 - In another company, every worker received a 5%...Ch. 1.2 - A sample of 100 adult women was taken, and each...Ch. 1.2 - In a sample of 20 men, the mean height was 178 cm....Ch. 1.2 - Each of 16 students measured the circumference of...Ch. 1.2 - Refer to Exercise 12. a. If the measurements for...Ch. 1.2 - There are 10 employees in a particular division of...Ch. 1.2 - Quartiles divide a sample into four nearly equal...Ch. 1.2 - In each of the following data sets, tell whether...Ch. 1.3 - The weather in Los Angeles is dry most of the...Ch. 1.3 - Forty-five specimens of a certain type of powder...Ch. 1.3 - Refer to Table 1.2 (in Section 1.2). Construct a...Ch. 1.3 - Following are measurements of soil concentrations...Ch. 1.3 - A certain reaction was run several times using...Ch. 1.3 - Sketch a histogram for which a. The mean is...Ch. 1.3 - The figure below is a histogram showing the...Ch. 1.3 - The histogram below presents the compressive...Ch. 1.3 - Refer to Table 1.4 (in Section 1.3). a. Using the...Ch. 1.3 - Refer to Table 1.5 (in Section 1.3). a. Using the...Ch. 1.3 - The following table presents the number of...Ch. 1.3 - Which of the following statistics cannot be...Ch. 1.3 - A sample of 100 resistors has an average...Ch. 1.3 - Following are boxplots comparing the amount of...Ch. 1.3 - Following are summary statistics for two data...Ch. 1.3 - Match each histogram to the box plot that...Ch. 1.3 - Prob. 17ECh. 1.3 - Match each scatterplot to the statement that best...Ch. 1.3 - Prob. 19ECh. 1 - A vendor converts the weights on the packages she...Ch. 1 - Refer to Exercise 1. The vendor begins using...Ch. 1 - The specification for the pull strength of a wire...Ch. 1 - A coin is tossed twice and comes up heads both...Ch. 1 - The smallest number on a list is changed from 12.9...Ch. 1 - There are 15 numbers on a list, and the smallest...Ch. 1 - There are 15 numbers on a list, and the mean is...Ch. 1 - The article The Selection of Yeast Strains for the...Ch. 1 - Concerning the data represented in the following...Ch. 1 - True or false: In any boxplot, a. The length of...Ch. 1 - For each of the following histograms, determine...Ch. 1 - In the article Occurrence and Distribution of...Ch. 1 - The article Vehicle-Arrival Characteristics at...Ch. 1 - The cumulative frequency and the cumulative...Ch. 1 - The article Hydrogeochemical Characteristics of...Ch. 1 - Water scarcity has traditionally been a major...Ch. 1 - Prob. 18SECh. 1 - The article The Ball-on-Three-Ball Test for...
Knowledge Booster


Learn more about
Need a deep-dive on the concept behind this application? Look no further. Learn more about this topic, statistics and related others by exploring similar questions and additional content below.Similar questions
- Exercise 6-6 (Algo) (LO6-3) The director of admissions at Kinzua University in Nova Scotia estimated the distribution of student admissions for the fall semester on the basis of past experience. Admissions Probability 1,100 0.5 1,400 0.4 1,300 0.1 Click here for the Excel Data File Required: What is the expected number of admissions for the fall semester? Compute the variance and the standard deviation of the number of admissions. Note: Round your standard deviation to 2 decimal places.arrow_forward1. Find the mean of the x-values (x-bar) and the mean of the y-values (y-bar) and write/label each here: 2. Label the second row in the table using proper notation; then, complete the table. In the fifth and sixth columns, show the 'products' of what you're multiplying, as well as the answers. X y x minus x-bar y minus y-bar (x minus x-bar)(y minus y-bar) (x minus x-bar)^2 xy 16 20 34 4-2 5 2 3. Write the sums that represents Sxx and Sxy in the table, at the bottom of their respective columns. 4. Find the slope of the Regression line: bi = (simplify your answer) 5. Find the y-intercept of the Regression line, and then write the equation of the Regression line. Show your work. Then, BOX your final answer. Express your line as "y-hat equals...arrow_forwardApply STATA commands & submit the output for each question only when indicated below i. Generate the log of birthweight and family income of children. Name these new variables Ibwght & Ifaminc. Include the output of this code. ii. Apply the command sum with the detail option to the variable faminc. Note: you should find the 25th percentile value, the 50th percentile and the 75th percentile value of faminc from the output - you will need it to answer the next question Include the output of this code. iii. iv. Use the output from part ii of this question to Generate a variable called "high_faminc" that takes a value 1 if faminc is less than or equal to the 25th percentile, it takes the value 2 if faminc is greater than 25th percentile but less than or equal to the 50th percentile, it takes the value 3 if faminc is greater than 50th percentile but less than or equal to the 75th percentile, it takes the value 4 if faminc is greater than the 75th percentile. Include the outcome of this code…arrow_forward
- solve this on paperarrow_forwardApply STATA commands & submit the output for each question only when indicated below i. Apply the command egen to create a variable called "wyd" which is the rowtotal function on variables bwght & faminc. ii. Apply the list command for the first 10 observations to show that the code in part i worked. Include the outcome of this code iii. Apply the egen command to create a new variable called "bwghtsum" using the sum function on variable bwght by the variable high_faminc (Note: need to apply the bysort' statement) iv. Apply the "by high_faminc" statement to find the V. descriptive statistics of bwght and bwghtsum Include the output of this code. Why is there a difference between the standard deviations of bwght and bwghtsum from part iv of this question?arrow_forwardAccording to a health information website, the distribution of adults’ diastolic blood pressure (in millimeters of mercury, mmHg) can be modeled by a normal distribution with mean 70 mmHg and standard deviation 20 mmHg. b. Above what diastolic pressure would classify someone in the highest 1% of blood pressures? Show all calculations used.arrow_forward
- Write STATA codes which will generate the outcomes in the questions & submit the output for each question only when indicated below i. ii. iii. iv. V. Write a code which will allow STATA to go to your favorite folder to access your files. Load the birthweight1.dta dataset from your favorite folder and save it under a different filename to protect data integrity. Call the new dataset babywt.dta (make sure to use the replace option). Verify that it contains 2,998 observations and 8 variables. Include the output of this code. Are there missing observations for variable(s) for the variables called bwght, faminc, cigs? How would you know? (You may use more than one code to show your answer(s)) Include the output of your code (s). Write the definitions of these variables: bwght, faminc, male, white, motheduc,cigs; which of these variables are categorical? [Hint: use the labels of the variables & the browse command] Who is this dataset about? Who can use this dataset to answer what kind of…arrow_forwardApply STATA commands & submit the output for each question only when indicated below İ. ii. iii. iv. V. Apply the command summarize on variables bwght and faminc. What is the average birthweight of babies and family income of the respondents? Include the output of this code. Apply the tab command on the variable called male. How many of the babies and what share of babies are male? Include the output of this code. Find the summary statistics (i.e. use the sum command) of the variables bwght and faminc if the babies are white. Include the output of this code. Find the summary statistics (i.e. use the sum command) of the variables bwght and faminc if the babies are male but not white. Include the output of this code. Using your answers to previous subparts of this question: What is the difference between the average birthweight of a baby who is male and a baby who is male but not white? What can you say anything about the difference in family income of the babies that are male and male…arrow_forwardA public health researcher is studying the impacts of nudge marketing techniques on shoppers vegetablesarrow_forward
- The director of admissions at Kinzua University in Nova Scotia estimated the distribution of student admissions for the fall semester on the basis of past experience. Admissions Probability 1,100 0.5 1,400 0.4 1,300 0.1 Click here for the Excel Data File Required: What is the expected number of admissions for the fall semester? Compute the variance and the standard deviation of the number of admissions. Note: Round your standard deviation to 2 decimal places.arrow_forwardA pollster randomly selected four of 10 available people. Required: How many different groups of 4 are possible? What is the probability that a person is a member of a group? Note: Round your answer to 3 decimal places.arrow_forwardWind Mountain is an archaeological study area located in southwestern New Mexico. Potsherds are broken pieces of prehistoric Native American clay vessels. One type of painted ceramic vessel is called Mimbres classic black-on-white. At three different sites the number of such sherds was counted in local dwelling excavations. Test given. Site I Site II Site III 63 19 60 43 34 21 23 49 51 48 11 15 16 46 26 20 31 Find .arrow_forward
arrow_back_ios
SEE MORE QUESTIONS
arrow_forward_ios
Recommended textbooks for you
 Glencoe Algebra 1, Student Edition, 9780079039897...AlgebraISBN:9780079039897Author:CarterPublisher:McGraw Hill
Glencoe Algebra 1, Student Edition, 9780079039897...
Algebra
ISBN:9780079039897
Author:Carter
Publisher:McGraw Hill
Correlation Vs Regression: Difference Between them with definition & Comparison Chart; Author: Key Differences;https://www.youtube.com/watch?v=Ou2QGSJVd0U;License: Standard YouTube License, CC-BY
Correlation and Regression: Concepts with Illustrative examples; Author: LEARN & APPLY : Lean and Six Sigma;https://www.youtube.com/watch?v=xTpHD5WLuoA;License: Standard YouTube License, CC-BY