
Statistics for Engineers and Scientists
4th Edition
ISBN: 9780073401331
Author: William Navidi Prof.
Publisher: McGraw-Hill Education
expand_more
expand_more
format_list_bulleted
Videos
Textbook Question
Chapter 1.3, Problem 5E
A certain reaction was run several times using each of two catalysts, A and B. The catalysts were supposed to control the yield of an undesirable side product. Results, in units of percentage yield, for 24 runs of catalyst A and 20 runs of catalyst B are as follows:
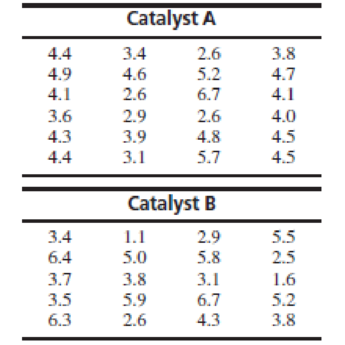
- a. Construct a histogram for the yields of each catalyst.
- b. Construct comparative boxplots for the yields of the two catalysts.
- c. Using the boxplots, what differences can be seen between the results of the yields of the two catalysts?
Expert Solution & Answer
Want to see the full answer?
Check out a sample textbook solution
Students have asked these similar questions
For the distribution shown, match the letter to the measure of central tendency.
A B C
C
Drag each of the letters into the appropriate measure of central tendency.
Mean
C
Median
A
Mode
B
A physician who has a group of 38 female patients aged 18 to 24 on a special diet wishes to estimate the effect of the diet on total serum cholesterol. For this group, their average serum cholesterol is 188.4 (measured in mg/100mL). Suppose that the total serum cholesterol measurements are normally distributed with standard deviation of 40.7. (a) Find a 95% confidence interval of the mean serum cholesterol of patients on the special diet.
The accompanying data represent the weights (in grams) of a simple random sample of 10 M&M plain candies. Determine the shape of the distribution of weights of M&Ms by drawing a frequency
histogram. Find the mean and median. Which measure of central tendency better describes the weight of a plain M&M?
Click the icon to view the candy weight data.
Draw a frequency histogram. Choose the correct graph below.
○ A.
○ C.
Frequency
Weight of Plain M and Ms
0.78
0.84
Frequency
OONAG
0.78
B.
0.9
0.96
Weight (grams)
Weight of Plain M and Ms
0.84
0.9
0.96
Weight (grams)
○ D.
Candy Weights
0.85 0.79 0.85 0.89 0.94
0.86 0.91 0.86 0.87 0.87
-
Frequency
☑
Frequency
67200
0.78
→
Weight of Plain M and Ms
0.9
0.96
0.84
Weight (grams)
Weight of Plain M and Ms
0.78
0.84
Weight (grams)
0.9
0.96
→
Chapter 1 Solutions
Statistics for Engineers and Scientists
Ch. 1.1 - Each of the following processes involves sampling...Ch. 1.1 - If you wanted to estimate the mean height of all...Ch. 1.1 - True or false: a. A simple random sample is...Ch. 1.1 - A sample of 100 college students is selected from...Ch. 1.1 - A certain process for manufacturing integrated...Ch. 1.1 - Refer to Exercise 5. True or false: a. If the...Ch. 1.1 - To determine whether a sample should be treated as...Ch. 1.1 - A medical researcher wants to determine whether...Ch. 1.1 - A medical researcher wants to determine whether...Ch. 1.2 - True or false: For any list of numbers, half of...
Ch. 1.2 - Is the sample mean always the most frequently...Ch. 1.2 - Is the sample mean always equal to one of the...Ch. 1.2 - Is the sample median always equal to one of the...Ch. 1.2 - Find a sample size for which the median will...Ch. 1.2 - For a list of positive numbers, is it possible for...Ch. 1.2 - Is it possible for the standard deviation of a...Ch. 1.2 - In a certain company, every worker received a...Ch. 1.2 - In another company, every worker received a 5%...Ch. 1.2 - A sample of 100 adult women was taken, and each...Ch. 1.2 - In a sample of 20 men, the mean height was 178 cm....Ch. 1.2 - Each of 16 students measured the circumference of...Ch. 1.2 - Refer to Exercise 12. a. If the measurements for...Ch. 1.2 - There are 10 employees in a particular division of...Ch. 1.2 - Quartiles divide a sample into four nearly equal...Ch. 1.2 - In each of the following data sets, tell whether...Ch. 1.3 - The weather in Los Angeles is dry most of the...Ch. 1.3 - Forty-five specimens of a certain type of powder...Ch. 1.3 - Refer to Table 1.2 (in Section 1.2). Construct a...Ch. 1.3 - Following are measurements of soil concentrations...Ch. 1.3 - A certain reaction was run several times using...Ch. 1.3 - Sketch a histogram for which a. The mean is...Ch. 1.3 - The figure below is a histogram showing the...Ch. 1.3 - The histogram below presents the compressive...Ch. 1.3 - Refer to Table 1.4 (in Section 1.3). a. Using the...Ch. 1.3 - Refer to Table 1.5 (in Section 1.3). a. Using the...Ch. 1.3 - The following table presents the number of...Ch. 1.3 - Which of the following statistics cannot be...Ch. 1.3 - A sample of 100 resistors has an average...Ch. 1.3 - Following are boxplots comparing the amount of...Ch. 1.3 - Following are summary statistics for two data...Ch. 1.3 - Match each histogram to the box plot that...Ch. 1.3 - Prob. 17ECh. 1.3 - Match each scatterplot to the statement that best...Ch. 1.3 - Prob. 19ECh. 1 - A vendor converts the weights on the packages she...Ch. 1 - Refer to Exercise 1. The vendor begins using...Ch. 1 - The specification for the pull strength of a wire...Ch. 1 - A coin is tossed twice and comes up heads both...Ch. 1 - The smallest number on a list is changed from 12.9...Ch. 1 - There are 15 numbers on a list, and the smallest...Ch. 1 - There are 15 numbers on a list, and the mean is...Ch. 1 - The article The Selection of Yeast Strains for the...Ch. 1 - Concerning the data represented in the following...Ch. 1 - True or false: In any boxplot, a. The length of...Ch. 1 - For each of the following histograms, determine...Ch. 1 - In the article Occurrence and Distribution of...Ch. 1 - The article Vehicle-Arrival Characteristics at...Ch. 1 - The cumulative frequency and the cumulative...Ch. 1 - The article Hydrogeochemical Characteristics of...Ch. 1 - Water scarcity has traditionally been a major...Ch. 1 - Prob. 18SECh. 1 - The article The Ball-on-Three-Ball Test for...
Knowledge Booster


Learn more about
Need a deep-dive on the concept behind this application? Look no further. Learn more about this topic, statistics and related others by exploring similar questions and additional content below.Similar questions
- The acidity or alkalinity of a solution is measured using pH. A pH less than 7 is acidic; a pH greater than 7 is alkaline. The accompanying data represent the pH in samples of bottled water and tap water. Complete parts (a) and (b). Click the icon to view the data table. (a) Determine the mean, median, and mode pH for each type of water. Comment on the differences between the two water types. Select the correct choice below and fill in any answer boxes in your choice. A. For tap water, the mean pH is (Round to three decimal places as needed.) B. The mean does not exist. Data table Тар 7.64 7.45 7.45 7.10 7.46 7.50 7.68 7.69 7.56 7.46 7.52 7.46 5.15 5.09 5.31 5.20 4.78 5.23 Bottled 5.52 5.31 5.13 5.31 5.21 5.24 - ☑arrow_forwardく Chapter 5-Section 1 Homework X MindTap - Cengage Learning x + C webassign.net/web/Student/Assignment-Responses/submit?pos=3&dep=36701632&tags=autosave #question3874894_3 M Gmail 品 YouTube Maps 5. [-/20 Points] DETAILS MY NOTES BBUNDERSTAT12 5.1.020. ☆ B Verify it's you Finish update: All Bookmarks PRACTICE ANOTHER A computer repair shop has two work centers. The first center examines the computer to see what is wrong, and the second center repairs the computer. Let x₁ and x2 be random variables representing the lengths of time in minutes to examine a computer (✗₁) and to repair a computer (x2). Assume x and x, are independent random variables. Long-term history has shown the following times. 01 Examine computer, x₁₁ = 29.6 minutes; σ₁ = 8.1 minutes Repair computer, X2: μ₂ = 92.5 minutes; σ2 = 14.5 minutes (a) Let W = x₁ + x2 be a random variable representing the total time to examine and repair the computer. Compute the mean, variance, and standard deviation of W. (Round your answers…arrow_forwardThe acidity or alkalinity of a solution is measured using pH. A pH less than 7 is acidic; a pH greater than 7 is alkaline. The accompanying data represent the pH in samples of bottled water and tap water. Complete parts (a) and (b). Click the icon to view the data table. (a) Determine the mean, median, and mode pH for each type of water. Comment on the differences between the two water types. Select the correct choice below and fill in any answer boxes in your choice. A. For tap water, the mean pH is (Round to three decimal places as needed.) B. The mean does not exist. Data table Тар Bottled 7.64 7.45 7.46 7.50 7.68 7.45 7.10 7.56 7.46 7.52 5.15 5.09 5.31 5.20 4.78 5.52 5.31 5.13 5.31 5.21 7.69 7.46 5.23 5.24 Print Done - ☑arrow_forward
- The median for the given set of six ordered data values is 29.5. 9 12 23 41 49 What is the missing value? The missing value is ☐.arrow_forwardFind the population mean or sample mean as indicated. Sample: 22, 18, 9, 6, 15 □ Select the correct choice below and fill in the answer box to complete your choice. O A. x= B. μεarrow_forwardWhy the correct answer is letter A? Students in an online course are each randomly assigned to receive either standard practice exercises or adaptivepractice exercises. For the adaptive practice exercises, the next question asked is determined by whether the studentgot the previous question correct. The teacher of the course wants to determine whether there is a differencebetween the two practice exercise types by comparing the proportion of students who pass the course from eachgroup. The teacher plans to test the null hypothesis that versus the alternative hypothesis , whererepresents the proportion of students who would pass the course using standard practice exercises andrepresents the proportion of students who would pass the course using adaptive practice exercises.The teacher knows that the percent confidence interval for the difference in proportion of students passing thecourse for the two practice exercise types (standard minus adaptive) is and the percent…arrow_forward
- Carpetland salespersons average $8,000 per week in sales. Steve Contois, the firm's vice president, proposes a compensation plan with new selling incentives. Steve hopes that the results of a trial selling period will enable him to conclude that the compensation plan increases the average sales per salesperson. a. Develop the appropriate null and alternative hypotheses.H 0: H a:arrow_forwardتوليد تمرين شامل حول الانحدار الخطي المتعدد بطريقة المربعات الصغرىarrow_forwardThe U.S. Postal Service will ship a Priority Mail® Large Flat Rate Box (12" 3 12" 3 5½") any where in the United States for a fixed price, regardless of weight. The weights (ounces) of 20 ran domly chosen boxes are shown below. (a) Make a stem-and-leaf diagram. (b) Make a histogram. (c) Describe the shape of the distribution. Weights 72 86 28 67 64 65 45 86 31 32 39 92 90 91 84 62 80 74 63 86arrow_forward
- (a) What is a bimodal histogram? (b) Explain the difference between left-skewed, symmetric, and right-skewed histograms. (c) What is an outlierarrow_forward(a) Test the hypothesis. Consider the hypothesis test Ho = : against H₁o < 02. Suppose that the sample sizes aren₁ = 7 and n₂ = 13 and that $² = 22.4 and $22 = 28.2. Use α = 0.05. Ho is not ✓ rejected. 9-9 IV (b) Find a 95% confidence interval on of 102. Round your answer to two decimal places (e.g. 98.76).arrow_forwardLet us suppose we have some article reported on a study of potential sources of injury to equine veterinarians conducted at a university veterinary hospital. Forces on the hand were measured for several common activities that veterinarians engage in when examining or treating horses. We will consider the forces on the hands for two tasks, lifting and using ultrasound. Assume that both sample sizes are 6, the sample mean force for lifting was 6.2 pounds with standard deviation 1.5 pounds, and the sample mean force for using ultrasound was 6.4 pounds with standard deviation 0.3 pounds. Assume that the standard deviations are known. Suppose that you wanted to detect a true difference in mean force of 0.25 pounds on the hands for these two activities. Under the null hypothesis, 40 = 0. What level of type II error would you recommend here? Round your answer to four decimal places (e.g. 98.7654). Use a = 0.05. β = i What sample size would be required? Assume the sample sizes are to be equal.…arrow_forward
arrow_back_ios
SEE MORE QUESTIONS
arrow_forward_ios
Recommended textbooks for you
 MATLAB: An Introduction with ApplicationsStatisticsISBN:9781119256830Author:Amos GilatPublisher:John Wiley & Sons Inc
 Probability and Statistics for Engineering and th...StatisticsISBN:9781305251809Author:Jay L. DevorePublisher:Cengage Learning
 Statistics for The Behavioral Sciences (MindTap C...StatisticsISBN:9781305504912Author:Frederick J Gravetter, Larry B. WallnauPublisher:Cengage Learning
 Elementary Statistics: Picturing the World (7th E...StatisticsISBN:9780134683416Author:Ron Larson, Betsy FarberPublisher:PEARSON
 The Basic Practice of StatisticsStatisticsISBN:9781319042578Author:David S. Moore, William I. Notz, Michael A. FlignerPublisher:W. H. Freeman
 Introduction to the Practice of StatisticsStatisticsISBN:9781319013387Author:David S. Moore, George P. McCabe, Bruce A. CraigPublisher:W. H. Freeman
MATLAB: An Introduction with Applications
Statistics
ISBN:9781119256830
Author:Amos Gilat
Publisher:John Wiley & Sons Inc
Probability and Statistics for Engineering and th...
Statistics
ISBN:9781305251809
Author:Jay L. Devore
Publisher:Cengage Learning
Statistics for The Behavioral Sciences (MindTap C...
Statistics
ISBN:9781305504912
Author:Frederick J Gravetter, Larry B. Wallnau
Publisher:Cengage Learning
Elementary Statistics: Picturing the World (7th E...
Statistics
ISBN:9780134683416
Author:Ron Larson, Betsy Farber
Publisher:PEARSON
The Basic Practice of Statistics
Statistics
ISBN:9781319042578
Author:David S. Moore, William I. Notz, Michael A. Fligner
Publisher:W. H. Freeman
Introduction to the Practice of Statistics
Statistics
ISBN:9781319013387
Author:David S. Moore, George P. McCabe, Bruce A. Craig
Publisher:W. H. Freeman
Hypothesis Testing using Confidence Interval Approach; Author: BUM2413 Applied Statistics UMP;https://www.youtube.com/watch?v=Hq1l3e9pLyY;License: Standard YouTube License, CC-BY
Hypothesis Testing - Difference of Two Means - Student's -Distribution & Normal Distribution; Author: The Organic Chemistry Tutor;https://www.youtube.com/watch?v=UcZwyzwWU7o;License: Standard Youtube License