Videos
Suppose that each firm in a competitive industry has the following costs:
Total cost: TC = 50 + ½ q2
Marginal cost: MC = q
where q is an individual firm’s quantity produced.
The market
Demand: QD = 120 − P
where P is the
a. What is each firm’s fixed cost? What is its variable cost? Give the equation for
b. Graph average-total-cost curve and the marginal-cost curve for q from 5 to 15. At what quantity is average-total-cost curve at its minimum? What is marginal cost and average total cost at that quantity?
c Give the equation for each firm’s supply curve.
d. Give the equation for the market supply curve for the short run in which the number of firms is fixed.
e. What is the
f. In this equilibrium, how much does each firm produce? Calculate each firm’s profit or loss. Is there incentive for firms to enter or exit?
g. In the long run with free entry and exit, what is the equilibrium price and quantity in this market?
h. In this long-run equilibrium, how much does each firm produce? How many firms are in the market?
Subpart (a):
Calculate average total cost.
Explanation of Solution
The total cost equation, marginal cost equation and demand equation are given below:
The fixed cost and variable cost of each firm are determined from Equation (1). Here, the fixed cost is a part of the total cost and will not change in response to a change in quantity. The variable cost is a part of the total cost and it changes in response to a change in quantity. So, the fixed cost is $50 and the variable cost is
Average total cost equation is represented below:
Or
Concept introduction:
Average total cost: The average total cost is the total cost per unit of the output produced by a firm.
Subpart (b):
Draw average total cost curve.
Explanation of Solution
Figure 1 represents the average total cost curve and marginal cost curve.
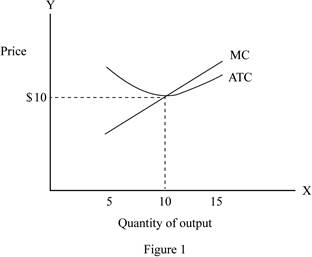
From the above figure, the x-axis shows the quantity of the output and the y-axis shows the price level.
From the graph, the average total cost is at its minimum, when they produce 10 units of output. The average total cost and marginal cost are at the quantity of 10 units of output.
Concept introduction:
Average total cost: The average total cost is the total cost per unit of the output produced by a firm.
Subpart (c):
Supply curve.
Explanation of Solution
In the perfect competition, the supply curve is even, as the marginal cost curve is beyond the intersecting point of the average total cost curve.
Supply curve for each firm is shown below:
Concept introduction:
Marginal cost curve: The marginal cost is the additional cost incurred on the additional production and its curve is U-shaped, which represents the combination of price level and quantity of output.
Subpart (d):
Quantity supply.
Explanation of Solution
In the short-run, there are currently 9 firms. So, the market supply curve is determined by using the following formula:
Hence, the short-run market supply curve is shown below:
Concept introduction:
Supply: Supply refers to the total value of the goods and services that are available for the purchase at a particular price in a given period of time.
Subpart (e):
Equilibrium price and quantity.
Explanation of Solution
The equilibrium quantity and price are determined by using the following formula:
Substitute the respective values in Equation (8) to calculate the equilibrium quantity and price.
Thus, the equilibrium price is $12.
Substitute the price of $12 in Equation (3) to calculate the equilibrium quantity.
Thus, the equilibrium quantity is 108 units.
Concept introduction:
Equilibrium price: It is the price at which the quantity demanded of a good or service is equal to the quantity supplied.
Equilibrium: It is the market price and quantity determined by equating the supply to the demand. At this equilibrium point, the supply will be equal to the demand and there will be no excess demand or supply in the economy. Thus, the economy will be at equilibrium.
Subpart (f):
Calculate profit.
Explanation of Solution
In the short-run equilibrium, each firm produces 12 units
Profit can be calculated by using the following formula:
Substitute the respective values in Equation (9) to calculate the profit.
Thus, the profit is $22.
Since the firms have positive value in making profit, there will be a benefit for the firm entering the market.
Concept introduction:
Profit: Profit refers to the excess revenue after subtracting the total cost from the total revenue.
Subpart (g):
Equilibrium quantity.
Explanation of Solution
In the long-run, the firm earns zero economic profit, so the price is equal to the minimum average total cost. Since the average total cost is $10, the equilibrium price is also be $10.
Equilibrium quantity can be determined by using Equation (3), when the equilibrium price is $10.
Thus, the long-run equilibrium quantity is 110.
Concept introduction:
Equilibrium: It is the market price and quantity determined by equating the supply to the demand. At this equilibrium point, the supply will be equal to the demand and there will be no excess demand or supply in the economy. Thus, the economy will be at equilibrium.
Subpart (h):
Number of firms in the long run.
Explanation of Solution
In the long-run, the firm produces 10 units of output. This is because in the long-run, the production price of the firm is equal to the minimum average total cost. The average total cost is 10 units. Also, there are 11 firms
Long run: Thelong run refers to the time, which changes the production variable to adjust to the market situation.
Want to see more full solutions like this?
Chapter 13 Solutions
Bundle: Essentials Of Economics, Loose-leaf Version, 8th + Lms Integrated Mindtap Economics, 1 Term (6 Months) Printed Access Card


- not use ai please don't kdjdkdkfjnxncjcarrow_forwardAsk one question at a time. Keep questions specific and include all details. Need more help? Subject matter experts with PhDs and Masters are standing by 24/7 to answer your question.**arrow_forward1b. (5 pts) Under the 1990 Farm Bill and given the initial situation of a target price and marketing loan, indicate where the market price (MP), quantity supplied (QS) and demanded (QD), government stocks (GS), and Deficiency Payments (DP) and Marketing Loan Gains (MLG), if any, would be on the graph below. If applicable, indicate the price floor (PF) on the graph. TP $ NLR So Do Q/yrarrow_forward
- Now, let us assume that Brie has altruistic preferences. Her utility function is now given by: 1 UB (xA, YA, TB,YB) = (1/2) (2x+2y) + (2x+2y) What would her utility be at the endowment now? (Round off your answer to the nearest whole number.) 110arrow_forwardProblema 4 (20 puntos): Supongamos que tenemos un ingreso de $120 y enfrentamos los precios P₁ =6 y P₂ =4. Nuestra función de utilidad es: U(x1, x2) = x0.4x0.6 a) Planteen el problema de optimización y obtengan las condiciones de primer orden. b) Encuentren el consumo óptimo de x1 y x2. c) ¿Cómo cambiará nuestra elección óptima si el ingreso aumenta a $180?arrow_forwardPlease draw the graph for number 4 and 5, I appreciate it!!arrow_forward
- not use ai pleasearrow_forwardnot use ai pleasearrow_forward• Prismatic Cards: A prismatic card will be a card that counts as having every suit. We will denote, e.g., a prismatic Queen card by Q*. With this notation, 2.3045 Q would be a double flush since every card is a diamond and a heart. • Wild Cards: A wild card counts as having every suit and every denomination. Denote wild cards with a W; if there are multiple, we will denote them W₁, W2, etc. With this notation, W2 20.30054 would be both a three-of-a-kind (three 2's) and a flush (5 diamonds). If we add multiple wild cards to the deck, they count as distinct cards, so that (e.g.) the following two hands count as "different hands" when counting: W15 5Q and W255◊♡♡♣♣ In addition, 1. Let's start with the unmodified double-suited deck. (a) Call a hand a flush house if it is a flush and a full house, i.e. if all cards share a suit and there are 3 cards of one denomination and two of another. For example, 550. house. How many different flush house hands are there? 2. Suppose we add one wild…arrow_forward
- not use ai pleasearrow_forwardIn a classic oil-drilling example, you are trying to decide whether to drill for oil on a field that might or might not contain any oil. Before making this decision, you have the option of hiring a geologist to perform some seismic tests and then predict whether there is any oil or not. You assess that if there is actually oil, the geologist will predict there is oil with probability 0.85 . You also assess that if there is no oil, the geologist will predict there is no oil with probability 0.90. Please answer the two questions below, as I am trying to ensure that I am correct. 1. Why will these two probabilities not appear on the decision tree? 2. Which probabilities will be on the decision tree?arrow_forwardAsap pleasearrow_forward

 Economics (MindTap Course List)EconomicsISBN:9781337617383Author:Roger A. ArnoldPublisher:Cengage Learning
 Managerial Economics: A Problem Solving ApproachEconomicsISBN:9781337106665Author:Luke M. Froeb, Brian T. McCann, Michael R. Ward, Mike ShorPublisher:Cengage Learning
 Microeconomics: Private and Public Choice (MindTa...EconomicsISBN:9781305506893Author:James D. Gwartney, Richard L. Stroup, Russell S. Sobel, David A. MacphersonPublisher:Cengage Learning
 Economics: Private and Public Choice (MindTap Cou...EconomicsISBN:9781305506725Author:James D. Gwartney, Richard L. Stroup, Russell S. Sobel, David A. MacphersonPublisher:Cengage Learning