Connect Hosted by ALEKS Access Card or Elementary Statistics
3rd Edition
ISBN: 9781260373752
Author: William Navidi Prof., Barry Monk Professor
Publisher: McGraw-Hill Education
bartleby

Concept explainers

bartleby

Videos

Question
Book Icon
Chapter 13, Problem 10CQ
To determine

To construct:a 95% prediction intervalfor anindividual response when x=20

Expert Solution & Answer
Check Mark

Answer to Problem 10CQ

  34.199±tα/26.07823093467

Explanation of Solution

Given information: x=20 and 95% prediction interval

    x2513161929191630y4020333050373437

Formula Used:the formula to be usedwhen constructing a prediction interval for an individual response.

Let x* be a value of the explanatory variable x , let y=b0+b1x* be the predicted value corresponding to x* and let n be the sample size .A level 100(1α)% prediction interval for an individual response is

  y±tα/2.se1+1n+ ( x * x ¯ )2 (x x ¯ ) 2

Here, the critical value tα/2 is based on n2 degrees of freedom.

  se - Residual standard deviation = (y y ) 2 n2

Test statistic t=(x1¯x2¯)(μ1μ2) s 1 2 n 1 + s 2 2 n 2

Calculation:sample means and the sample variances can be calculated as shown.

  xyx¯y¯xx¯yy¯ ( x x ¯ )2 ( y y ¯ )2254020.87535.1254.1254.87517.01562523.76562513207.87515.12562.015625228.7656316334.8752.12523.7656254.51562519301.8755.1253.51562526.26562529508.12514.87566.015625221.2656319371.8751.8753.5156253.51562516344.8751.12523.7656251.26562530379.1251.87583.2656253.515625

Sample means;

  x¯=xnx¯=(35+13+16+19+29+19+16+30)8x¯=1678x¯=20.875

  y¯=yny¯=(40+20+33+30+50+37+34+37)8y¯=2818y¯=35.125

Sample variances;

  sx2= (x x ¯ ) 2 n1sx2= (2520.875)2+ (1320.875)2+...........+ (3020.875)281sx2=282.8757sx2=40.4107143sx=6.35694221

  sy2= (y y ¯ ) 2 n1sy2= (4035.125)2+ (2035.125)2+...........+ (3735.125)281sy2=512.8757sy2=73.267857sy=8.5596645

The correlation coefficient is calculated as shown.

  r=1(n1) (x x ¯ )(y y ¯ )sxsyr=1(81)(4.125)(4.875)+........+(9.125)(1.875)(6.35694221)(8.5596645)r=1(81)299.125(6.35694221)(8.5596645)r=0.785325

Also, the least square regression line can be calculated as shown.

  y=b0+b1x

Here;

  b1=rsysxb1=0.785325( 6.35694221 8.5596645)b1=1.0574

Here;

  b0=y¯b1x¯b0=35.125(1.0574)(20.875)b0=13.051

Therefore,

  y=b0+b1xy=13.051+1.0574x

Now we need to calculate the residuals to find the se - Residual standard deviation.

  xyy=13.051+1.0574xyy ( y y )2254039.4860.5140.264196132026.79726.797246.20193163329.96943.03069.184536193033.14163.14169.869651295043.71566.284439.49368193733.14163.858414.88725163429.96944.030616.24574303744.7737.77360.41953

  se= (y y ) 2 n2se= 0.264196+........+60.41953 82se= 196.56656se=32.76109se=5.72373

Finally we can now calculate the prediction interval for an individual response.

  y±tα/2.se1+1n+ ( x * x ¯ )2 (x x ¯ ) 2

Here; when x=20 ;

  y=13.051+1.057xy=13.051+1.057(20)y=34.199

And;

   ( x * x ¯ ) 2 = (2020.875) 2 =0.765625

And;

   (x x ¯ )2=282.875

Therefore;

  y±tα/2.se1+1n+ ( x * x ¯ ) 2 (x x ¯ ) 2 34.199±tα/2(5.72373)1+18+ 0.765625 282.87534.199±tα/2(5.72373)(1.0619353)34.199±tα/26.07823093467

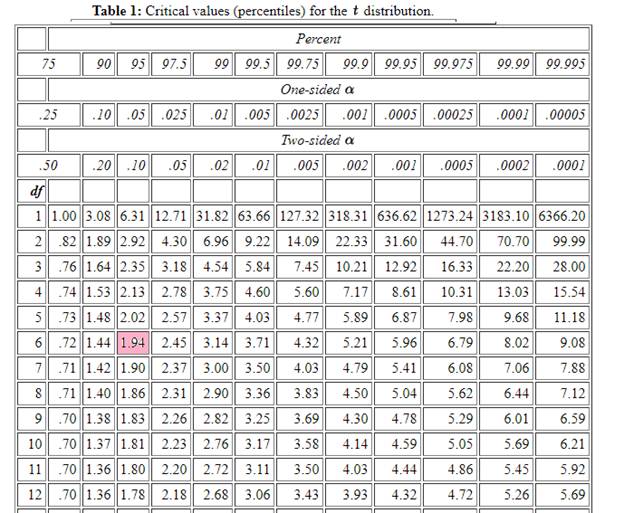
Please note there wasn’t a table given in the book to find corresponding t-value for the given confidence interval 95% and degrees of freedom 6 as shown below.

  Connect Hosted by ALEKS Access Card or Elementary Statistics, Chapter 13, Problem 10CQ , additional homework tip  1

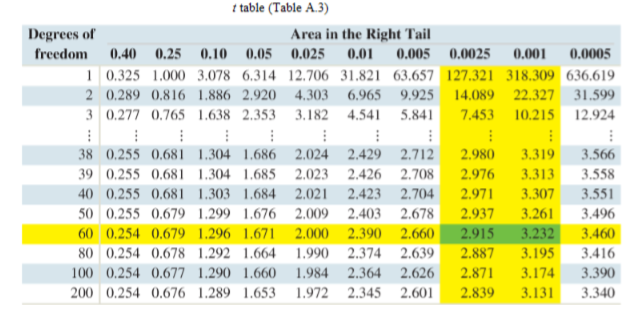
The t table below statescorresponding t-value for the given confidence interval 95% and degrees of freedom 6 can be read as 1.94 .

  Connect Hosted by ALEKS Access Card or Elementary Statistics, Chapter 13, Problem 10CQ , additional homework tip  2

Want to see more full solutions like this?

Subscribe now to access step-by-step solutions to millions of textbook problems written by subject matter experts!
Students have asked these similar questions
Suppose a sample of O-rings was obtained and the wall thickness (in inches) of each was recorded. Use a normal probability plot to assess whether the sample data could have come from a population that is normally distributed. Click here to view the table of critical values for normal probability plots. Click here to view page 1 of the standard normal distribution table. Click here to view page 2 of the standard normal distribution table. 0.191 0.186 0.201 0.2005 0.203 0.210 0.234 0.248 0.260 0.273 0.281 0.290 0.305 0.310 0.308 0.311 Using the correlation coefficient of the normal probability plot, is it reasonable to conclude that the population is normally distributed? Select the correct choice below and fill in the answer boxes within your choice. (Round to three decimal places as needed.) ○ A. Yes. The correlation between the expected z-scores and the observed data, , exceeds the critical value, . Therefore, it is reasonable to conclude that the data come from a normal population. ○…
ding question ypothesis at a=0.01 and at a = 37. Consider the following hypotheses: 20 Ho: μ=12 HA: μ12 Find the p-value for this hypothesis test based on the following sample information. a. x=11; s= 3.2; n = 36 b. x = 13; s=3.2; n = 36 C. c. d. x = 11; s= 2.8; n=36 x = 11; s= 2.8; n = 49
13. A pharmaceutical company has developed a new drug for depression. There is a concern, however, that the drug also raises the blood pressure of its users. A researcher wants to conduct a test to validate this claim. Would the manager of the pharmaceutical company be more concerned about a Type I error or a Type II error? Explain.

Chapter 13 Solutions

Connect Hosted by ALEKS Access Card or Elementary Statistics

Ch. 13.1 - Prob. 17ECh. 13.1 - Prob. 18ECh. 13.1 - Prob. 19ECh. 13.1 - Prob. 20ECh. 13.1 - Prob. 21ECh. 13.1 - Prob. 22ECh. 13.1 - Prob. 23ECh. 13.1 - Prob. 24ECh. 13.1 - Prob. 25ECh. 13.1 - Prob. 26ECh. 13.1 - Prob. 27ECh. 13.1 - Prob. 28ECh. 13.1 - Prob. 26aECh. 13.1 - Calculator display: The following TI-84 Plus...Ch. 13.1 - Prob. 28aECh. 13.1 - Prob. 29ECh. 13.1 - Prob. 30ECh. 13.1 - Confidence interval for the conditional mean: In...Ch. 13.2 - Prob. 3ECh. 13.2 - Prob. 4ECh. 13.2 - Prob. 5ECh. 13.2 - Prob. 6ECh. 13.2 - Prob. 7ECh. 13.2 - Prob. 8ECh. 13.2 - Prob. 9ECh. 13.2 - Prob. 10ECh. 13.2 - Prob. 11ECh. 13.2 - Prob. 12ECh. 13.2 - Prob. 13ECh. 13.2 - Prob. 14ECh. 13.2 - Prob. 15ECh. 13.2 - Prob. 16ECh. 13.2 - Prob. 17ECh. 13.2 - Dry up: Use the data in Exercise 26 in Section...Ch. 13.2 - Prob. 19ECh. 13.2 - Prob. 20ECh. 13.2 - Prob. 21ECh. 13.3 - Prob. 7ECh. 13.3 - Prob. 8ECh. 13.3 - Prob. 9ECh. 13.3 - In Exercises 9 and 10, determine whether the...Ch. 13.3 - Prob. 11ECh. 13.3 - Prob. 12ECh. 13.3 - Prob. 13ECh. 13.3 - For the following data set: Construct the multiple...Ch. 13.3 - Engine emissions: In a laboratory test of a new...Ch. 13.3 - Prob. 16ECh. 13.3 - Prob. 17ECh. 13.3 - Prob. 18ECh. 13.3 - Prob. 19ECh. 13.3 - Prob. 20ECh. 13.3 - Prob. 21ECh. 13.3 - Prob. 22ECh. 13.3 - Prob. 23ECh. 13 - A confidence interval for 1 is to be constructed...Ch. 13 - A confidence interval for a mean response and a...Ch. 13 - Prob. 3CQCh. 13 - Prob. 4CQCh. 13 - Prob. 5CQCh. 13 - Prob. 6CQCh. 13 - Construct a 95% confidence interval for 1.Ch. 13 - Prob. 8CQCh. 13 - Prob. 9CQCh. 13 - Prob. 10CQCh. 13 - Prob. 11CQCh. 13 - Prob. 12CQCh. 13 - Prob. 13CQCh. 13 - Prob. 14CQCh. 13 - Prob. 15CQCh. 13 - Prob. 1RECh. 13 - Prob. 2RECh. 13 - Prob. 3RECh. 13 - Prob. 4RECh. 13 - Prob. 5RECh. 13 - Prob. 6RECh. 13 - Prob. 7RECh. 13 - Prob. 8RECh. 13 - Prob. 9RECh. 13 - Prob. 10RECh. 13 - Air pollution: Following are measurements of...Ch. 13 - Icy lakes: Following are data on maximum ice...Ch. 13 - Prob. 13RECh. 13 - Prob. 14RECh. 13 - Prob. 15RECh. 13 - Prob. 1WAICh. 13 - Prob. 2WAICh. 13 - Prob. 1CSCh. 13 - Prob. 2CSCh. 13 - Prob. 3CSCh. 13 - Prob. 4CSCh. 13 - Prob. 5CSCh. 13 - Prob. 6CSCh. 13 - Prob. 7CS
Knowledge Booster
Background pattern image
Statistics
Learn more about
Need a deep-dive on the concept behind this application? Look no further. Learn more about this topic, statistics and related others by exploring similar questions and additional content below.
Similar questions
SEE MORE QUESTIONS
Recommended textbooks for you
Text book image
Glencoe Algebra 1, Student Edition, 9780079039897...
Algebra
ISBN:9780079039897
Author:Carter
Publisher:McGraw Hill
Text book image
College Algebra (MindTap Course List)
Algebra
ISBN:9781305652231
Author:R. David Gustafson, Jeff Hughes
Publisher:Cengage Learning
Text book image
Holt Mcdougal Larson Pre-algebra: Student Edition...
Algebra
ISBN:9780547587776
Author:HOLT MCDOUGAL
Publisher:HOLT MCDOUGAL
Text book image
Big Ideas Math A Bridge To Success Algebra 1: Stu...
Algebra
ISBN:9781680331141
Author:HOUGHTON MIFFLIN HARCOURT
Publisher:Houghton Mifflin Harcourt
What is a Linear Equation in One Variable?; Author: Don't Memorise;https://www.youtube.com/watch?v=lDOYdBgtnjY;License: Standard YouTube License, CC-BY
Linear Equation | Solving Linear Equations | What is Linear Equation in one variable ?; Author: Najam Academy;https://www.youtube.com/watch?v=tHm3X_Ta_iE;License: Standard YouTube License, CC-BY