
Concept explainers
Videos
To Find: The values of minimum, first quartile, median, third quartile, and maximum of each data set.
Answer to Problem 11MCQ
The value of the minimum of the data set (2) is
Explanation of Solution
Given information:
The value of Commute
Calculation:
Let us consider the data for the commute
Identify the minimum, first quartile, median, third quartile, and maximum of each data set (1). Then make a box and whisker plot.
Use two parts to given the answer: in first part identify the minimum, first quartile, median, third quartile, and maximum of each data set, and in the second part make a box and whisker plot.
Part I: use the following steps to identify minimum, first quartile, median, third quartile, and maximum of each data set given in (1).
Step 1: arrange the data in increasing order that is order from least to greatest.
Step 2: Find the minimum and maximum:
Minimum: The least number is data set is called the minimum. Therefore the minimum of the data set (2) is
Maximum: The greatest number in data set is called maximum. Therefore the maximum of the data set (2) is
Step 3: Find the median.
Median: The median is the middle value in the data set, when data values are arranged in order and it is represented by
Median:
Step 4: Find the first quartile and third quartile.
First Quartile: If the data set is divided into four equal parts, then the first quartile is the median of the lower half of the data and it is represented by
The median of the lower half of the data is
Therefore first quartile
Third Quartile: If the data set is divided in to four equal parts, then the third quartile is the median of the upper half of the data and it is represented by
The median of the upper half of the data is
Therefore, the value of Third quartile is
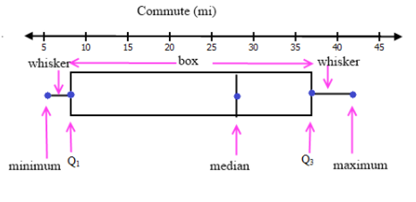
Part II: Make a box-and whisker plot for the data
A box-and −whisker plot is a graph that represented a set of data along a horizontal line. It consist three parts: a box, extended from first quartile to third quartile and has vertical line through median and two whiskers, the left whisker extended from minimum to first quartile and the right whisker extended from third quartile to the minimum.
Therefore, the box is;
Therefore, value of the minimum of the data set (2) is
Chapter 12 Solutions
High School Math 2011 Algebra 1 Student Companion Grade 8/9
Additional Math Textbook Solutions
Pre-Algebra Student Edition
Elementary Statistics: Picturing the World (7th Edition)
University Calculus: Early Transcendentals (4th Edition)
Calculus: Early Transcendentals (2nd Edition)
A Problem Solving Approach To Mathematics For Elementary School Teachers (13th Edition)
A First Course in Probability (10th Edition)


- Which graph represents the solution of y > x2 + 2?arrow_forwardA boat's value over time, x, is given as the function f(x) = 400(b)x. Which graph shows the boat's value decreasing at a rate of 25% per year?arrow_forwardA boat's value over time, x, is given as the function f(x) = 400(b)x. Graph the boat's value decreasing at a rate of 25% per year?arrow_forward
- Describe the y-intercept and end behavior of the following graph: 0 2 4 -2 -4 -6arrow_forwardComputing Ending Inventory under Dollar-Value LIFO Wheels Inc. accounts for inventory using the dollar-value LIFO method. The following information is available for Year 1 through Year 3 (listed chronologically). Year Ending Inventory at FIFO Price Index Year 1 Year 2 Year 3 $6,000 1.00 9,600 1.10 12,000 1.13 Compute ending inventory under the dollar-value LIFO method for Year 1, Year 2, and Year 3. • Note: Round your answers to the nearest whole dollar.arrow_forwardUpland Co.'s inventory records showed the following data accounted for in a perpetual inventory system. Unit Date June 1 Units Cost Inventory (beg.) 700 $8.00 June 3 Purchases 1,400 8.40 June 7 Sales (at $16 per unit) 980 952 9.00 June 20 Purchases June 22 Sales (at $16 per unit) 1,540 What is (a) ending inventory on June 30, and (b) cost of goods sold for June, using the FIFO inventory method? •Note: Do not use negative signs with any of your answers. •Note: List the inventory units in chronological order based on their purchase date with beginning inventory, if any, listed first.arrow_forward
- Explain how solve 4x + 3 = 7 using the change of base formula logy: logy. Include the solution for x in your answer. Round your answer to the nearest thousandth. log barrow_forward5. Consider the following vectors 0.1 3.2 -0-0-0 = 5.4 6.0 = z= 3 0.1 For each of exercises a-e, either compute the desired quantity by hand with work shown or explain why the desired quantity is not defined. (a) 10x (b) 10-27 (c) J+Z (d) (x, y) (e) (x, z)arrow_forwardConsider the graph/network plotted below. 1 6 5 3 Explicitly give (i.e., write down all of the entries) the adjacency matrix A of the graph.arrow_forward
 Algebra and Trigonometry (6th Edition)AlgebraISBN:9780134463216Author:Robert F. BlitzerPublisher:PEARSON
 Contemporary Abstract AlgebraAlgebraISBN:9781305657960Author:Joseph GallianPublisher:Cengage Learning
 Linear Algebra: A Modern IntroductionAlgebraISBN:9781285463247Author:David PoolePublisher:Cengage Learning
 Algebra And Trigonometry (11th Edition)AlgebraISBN:9780135163078Author:Michael SullivanPublisher:PEARSON
 Introduction to Linear Algebra, Fifth EditionAlgebraISBN:9780980232776Author:Gilbert StrangPublisher:Wellesley-Cambridge Press
 College Algebra (Collegiate Math)AlgebraISBN:9780077836344Author:Julie Miller, Donna GerkenPublisher:McGraw-Hill Education