Concept explainers
a. Find the median murder rate per 100.000 residents for the 50 states and Washington, D.C
b. Find the first quartile by determining the median of the lower half of the data. (This is the median of the items that lie below the median that you found in part (a).)
c. Find the third quartile by determining the median of the upper half of the data. (This is the median of the items that lie above the median that you found in part (a).)
d. Use the following numerical scale:

Above this scale, show five points, each at the same height. (The height is arbitrary.)Each point should represent one of the following numbers:
lowest data value, first quartile, median, third quartile, highest data value
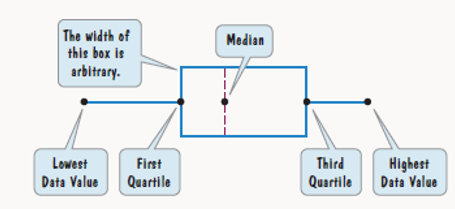
e. A box-arid-whisker plot consists of a rectangular box extending from the first quartile to the third quartile, with a dashed line representing the median, and line segments (or whiskers) extending outward from the box to the lowest and highest data values:

Use your graph from part (d) lo create a box-and-whisker plot for U.S. murder rates per 100,000 residents
f. If one of the whiskers in a box-and-whisker plot is clearly longer, the distribution is usually skewed in the direction of the longer whisker. Based on this observation, does your box-and-whisker plot in part (e) indicate that the distribution is skewed to the right or skewed to the left?
g. Is the shape of the distribution of scores shown by the given histogram consistent with your observation in part (f)?
Want to see the full answer?
Check out a sample textbook solution
Chapter 12 Solutions
Thinking Mathematically, Books A La Carte Edition Format: Unbound (saleable)
- 5. [-/1 Points] DETAILS MY NOTES SESSCALCET2 6.5.AE.003. y y= ex² 0 Video Example x EXAMPLE 3 (a) Use the Midpoint Rule with n = 10 to approximate the integral कर L'ex² dx. (b) Give an upper bound for the error involved in this approximation. SOLUTION 8+2 1 L'ex² d (a) Since a = 0, b = 1, and n = 10, the Midpoint Rule gives the following. (Round your answer to six decimal places.) dx Ax[f(0.05) + f(0.15) + ... + f(0.85) + f(0.95)] 0.1 [0.0025 +0.0225 + + e0.0625 + 0.1225 e0.3025 + e0.4225 + e0.2025 + + e0.5625 €0.7225 +0.9025] The figure illustrates this approximation. (b) Since f(x) = ex², we have f'(x) = 0 ≤ f'(x) = < 6e. ASK YOUR TEACHER and f'(x) = Also, since 0 ≤ x ≤ 1 we have x² ≤ and so Taking K = 6e, a = 0, b = 1, and n = 10 in the error estimate, we see that an upper bound for the error is as follows. (Round your final answer to five decimal places.) 6e(1)3 e 24( = ≈arrow_forward1. Consider the following preference ballots: Number of voters Rankings 6 5 4 2 1st choice A DCB DC 2nd choice B B D 3rd choice DCBD 4th choice CA AAA For each of the four voting systems we have studied, determine who would win the election in each case. (Remember: For plurality with runoff, all but the top two vote-getters are simultaneously eliminated at the end of round 1.)arrow_forwardPractice k Help ises A 96 Anewer The probability that you get a sum of at least 10 is Determine the number of ways that the specified event can occur when two number cubes are rolled. 1. Getting a sum of 9 or 10 3. Getting a sum less than 5 2. Getting a sum of 6 or 7 4. Getting a sum that is odd Tell whether you would use the addition principle or the multiplication principle to determine the total number of possible outcomes for the situation described. 5. Rolling three number cubes 6. Getting a sum of 10 or 12 after rolling three number cubes A set of playing cards contains four groups of cards designated by color (black, red, yellow, and green) with cards numbered from 1 to 14 in each group. Determine the number of ways that the specified event can occur when a card is drawn from the set. 7. Drawing a 13 or 14 9. Drawing a number less than 4 8. Drawing a yellow or green card 10. Drawing a black, red, or green car The spinner is divided into equal parts. Find the specified…arrow_forward
- Problem 1.We consider a two-period binomial model with the following properties: each period lastsone (1) year and the current stock price is S0 = 4. On each period, the stock price doubleswhen it moves up and is reduced by half when it moves down. The annual interest rateon the money market is 25%. We consider four options on this market: A European call option with maturity T = 2 years and strike price K = 5; A European put option with maturity T = 2 years and strike price K = 5; An American call option with maturity T = 2 years and strike price K = 5; An American put option with maturity T = 2 years and strike price K = 5.(a) Find the price at time 0 of both European options.(b) Find the price at time 0 of both American options. Compare your results with (a)and comment.(c) For each of the American options, describe the optimal exercising strategy.(d) We assume that you sell the American put to a market participant A for the pricefound in (b). Explain how you act on the market…arrow_forwardWhat is the standard scores associated to the left of z is 0.1446arrow_forward2. [-/1 Points] DETAILS MY NOTES SESSCALCET2 6.5.015. Use the Trapezoidal Rule, the Midpoint Rule, and Simpson's Rule to approximate the given integral with the specified value of n. (Round your answers to six decimal places.) ASK YOUR TEACHER 3 1 3 + dy, n = 6 (a) the Trapezoidal Rule (b) the Midpoint Rule (c) Simpson's Rule Need Help? Read It Watch Itarrow_forward
- This question builds on an earlier problem. The randomized numbers may have changed, but have your work for the previous problem available to help with this one. A 4-centimeter rod is attached at one end to a point A rotating counterclockwise on a wheel of radius 2 cm. The other end B is free to move back and forth along a horizontal bar that goes through the center of the wheel. At time t=0 the rod is situated as in the diagram at the left below. The wheel rotates counterclockwise at 1.5 rev/sec. At some point, the rod will be tangent to the circle as shown in the third picture. B A B at some instant, the piston will be tangent to the circle (a) Express the x and y coordinates of point A as functions of t: x= 2 cos(3πt) and y= 2 sin(3πt) (b) Write a formula for the slope of the tangent line to the circle at the point A at time t seconds: -cot (3πt) (c) Express the x-coordinate of the right end of the rod at point B as a function of t: 2 cos(3πt) +41/1 (d) Express the slope of the rod…arrow_forwardConsider the proof below: Proposition: If m is an even integer, then 5m +4 is an even integer. Proof: We see that |5m+4=10n+4 = 2(5n+2). Therefore, 5m+4 is an even integer. **Note: you may assume the proof is valid, just poorly written. Based upon the Section 1.3 screencast and the reading assignment, select all writing guidelines that are missing in the proof. Proof begins by stating assumptions ✓ Proof has an invitational tone/uses collective pronouns Proof is written in complete sentences Each step is justified ☐ Proof has a clear conclusionarrow_forwardNote: The purpose of this problem below is to use computational techniques (Excelspreadsheet, Matlab, R, Python, etc.) and code the dynamic programming ideas seen inclass. Please provide the numerical answer to the questions as well as a sample of yourwork (spreadsheet, code file, etc.).We consider an N-period binomial model with the following properties: N = 60, thecurrent stock price is S0 = 1000; on each period, the stock price increases by 0.5% whenit moves up and decreases by 0.3% when it moves down. The annual interest rate on themoney market is 5%. (Notice that this model is a CRR model, which means that thebinomial tree is recombining.)(a) Find the price at time t0 = 0 of a (European) call option with strike price K = 1040and maturity T = 1 year.(b) Find the price at time t0 = 0 of a (European) put option with strike price K = 1040and maturity T = 1 year.(c) We consider now, that you are at time t5 (i.e. after 5 periods, which represents 1month later). Assume that the stock…arrow_forward
- 4. [-/1 Points] DETAILS MY NOTES SESSCALCET2 6.5.024. Find the approximations Tη, Mn, and S, to the integral computer algebra system.) ASK YOUR TEACHER PRACTICE ANOTHER 4 39 √ dx for n = 6 and 12. Then compute the corresponding errors ET, EM, and Es. (Round your answers to six decimal places. You may wish to use the sum command on a n Tn Mn Sp 6 12 n ET EM Es 6 12 What observations can you make? In particular, what happens to the errors when n is doubled? As n is doubled, ET and EM are decreased by a factor of about Need Help? Read It ' and Es is decreased by a factor of aboutarrow_forward6. [-/1 Points] DETAILS MY NOTES SESSCALCET2 6.5.001. ASK YOUR TEACHER PRACTICE ANOTHER Let I = 4 f(x) dx, where f is the function whose graph is shown. = √ ² F(x 12 4 y f 1 2 (a) Use the graph to find L2, R2 and M2. 42 = R₂ = M₂ = 1 x 3 4arrow_forwardThe general solution X'=Ax is given. Discuss the nature of the solutions in a neighborhood of (0,0) -2-2 (²) |a) A = (23) X(A) = (₁ (fi)e* + (2 (2) eht -2-5arrow_forward
 Big Ideas Math A Bridge To Success Algebra 1: Stu...AlgebraISBN:9781680331141Author:HOUGHTON MIFFLIN HARCOURTPublisher:Houghton Mifflin Harcourt
 Glencoe Algebra 1, Student Edition, 9780079039897...AlgebraISBN:9780079039897Author:CarterPublisher:McGraw Hill
 Holt Mcdougal Larson Pre-algebra: Student Edition...AlgebraISBN:9780547587776Author:HOLT MCDOUGALPublisher:HOLT MCDOUGAL


