
Applied Statistics in Business and Economics
5th Edition
ISBN: 9780077837303
Author: David Doane, Lori Seward Senior Instructor of Operations Management
Publisher: McGraw-Hill Education
expand_more
expand_more
format_list_bulleted
Concept explainers
Videos
Textbook Question
Chapter 12.4, Problem 18SE
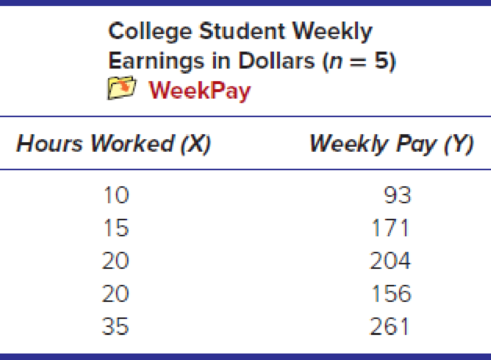
Instructions for exercises 12.18 and 12.19: (a) Make an Excel worksheet to calculate SSxx, SSyy, and SSxy (the same worksheet you used in exercises 12.2 and 12.3). (b) Use the formulas to calculate the slope and intercept. (c) Use your estimated slope and intercept to make a worksheet to calculate SSE, SSR, and SST. (d) Use these sums to calculate the R2. (e) To check your answers, make an Excel
12.18
Expert Solution & Answer
Want to see the full answer?
Check out a sample textbook solution
Students have asked these similar questions
Harvard University
California Institute of Technology
Massachusetts Institute of Technology
Stanford University
Princeton University
University of Cambridge
University of Oxford
University of California, Berkeley
Imperial College London
Yale University
University of California, Los Angeles
University of Chicago
Johns Hopkins University
Cornell University
ETH Zurich
University of Michigan
University of Toronto
Columbia University
University of Pennsylvania
Carnegie Mellon University
University of Hong Kong
University College London
University of Washington
Duke University
Northwestern University
University of Tokyo
Georgia Institute of Technology
Pohang University of Science and Technology
University of California, Santa Barbara
University of British Columbia
University of North Carolina at Chapel Hill
University of California, San Diego
University of Illinois at Urbana-Champaign
National University of Singapore
McGill…
Name
Harvard University
California Institute of Technology
Massachusetts Institute of Technology
Stanford University
Princeton University
University of Cambridge
University of Oxford
University of California, Berkeley
Imperial College London
Yale University
University of California, Los Angeles
University of Chicago
Johns Hopkins University
Cornell University
ETH Zurich
University of Michigan
University of Toronto
Columbia University
University of Pennsylvania
Carnegie Mellon University
University of Hong Kong
University College London
University of Washington
Duke University
Northwestern University
University of Tokyo
Georgia Institute of Technology
Pohang University of Science and Technology
University of California, Santa Barbara
University of British Columbia
University of North Carolina at Chapel Hill
University of California, San Diego
University of Illinois at Urbana-Champaign
National University of Singapore…
A company found that the daily sales revenue of its flagship product follows a normal distribution with a mean of $4500 and a standard deviation of $450. The company defines a "high-sales day" that is, any day with sales exceeding $4800. please provide a step by step on how to get the answers in excel
Q: What percentage of days can the company expect to have "high-sales days" or sales greater than $4800?
Q: What is the sales revenue threshold for the bottom 10% of days? (please note that 10% refers to the probability/area under bell curve towards the lower tail of bell curve)
Provide answers in the yellow cells
Chapter 12 Solutions
Applied Statistics in Business and Economics
Ch. 12.1 - Prob. 1SECh. 12.1 - Prob. 2SECh. 12.1 - Prob. 3SECh. 12.1 - Prob. 4SECh. 12.1 - Prob. 5SECh. 12.1 - Prob. 6SECh. 12.2 - (a) Interpret the slope of the fitted regression...Ch. 12.2 - (a) Interpret the slope of the fitted regression...Ch. 12.2 - Prob. 9SECh. 12.2 - (a) Interpret the slope of the fitted regression...
Ch. 12.2 - (a) Interpret the slope of the fitted regression...Ch. 12.3 - Prob. 12SECh. 12.3 - Prob. 13SECh. 12.3 - The regression equation Credits = 15.4 .07 Work...Ch. 12.3 - Below are fitted regressions for Y = asking price...Ch. 12.3 - Refer back to the regression equation in exercise...Ch. 12.3 - Refer back to the regression equation in exercise...Ch. 12.4 - Instructions for exercises 12.18 and 12.19: (a)...Ch. 12.4 - Instructions for exercises 12.18 and 12.19: (a)...Ch. 12.4 - Instructions for exercises 12.2012.22: (a) Use...Ch. 12.4 - Instructions for exercises 12.2012.22: (a) Use...Ch. 12.4 - Instructions for exercises 12.2012.22: (a) Use...Ch. 12.5 - Instructions for exercises 12.23 and 12.24: (a)...Ch. 12.5 - Prob. 24SECh. 12.5 - A regression was performed using data on 32 NFL...Ch. 12.5 - A regression was performed using data on 16...Ch. 12.6 - Prob. 27SECh. 12.6 - Prob. 28SECh. 12.6 - Instructions for exercises 12.2912.31: (a) Use...Ch. 12.6 - Instructions for exercises 12.2912.31: (a) Use...Ch. 12.6 - Instructions for exercises 12.2912.31: (a) Use...Ch. 12.7 - Refer to the Weekly Earnings data set below. (a)...Ch. 12.7 - Prob. 33SECh. 12.8 - Prob. 34SECh. 12.8 - Prob. 35SECh. 12.9 - An estimated regression for a random sample of...Ch. 12.9 - An estimated regression for a random sample of...Ch. 12.9 - Prob. 38SECh. 12.9 - Prob. 39SECh. 12 - (a) How does correlation analysis differ from...Ch. 12 - (a) What is a simple regression model? (b) State...Ch. 12 - (a) Explain how you fit a regression to an Excel...Ch. 12 - (a) Explain the logic of the ordinary least...Ch. 12 - (a) Why cant we use the sum of the residuals to...Ch. 12 - Prob. 6CRCh. 12 - Prob. 7CRCh. 12 - Prob. 8CRCh. 12 - Prob. 9CRCh. 12 - Prob. 10CRCh. 12 - Prob. 11CRCh. 12 - Prob. 12CRCh. 12 - (a) What is heteroscedasticity? Identify its two...Ch. 12 - (a) What is autocorrelation? Identify two main...Ch. 12 - Prob. 15CRCh. 12 - Prob. 16CRCh. 12 - (a) What is a log transform? (b) What are its...Ch. 12 - Prob. 40CECh. 12 - Prob. 41CECh. 12 - Prob. 42CECh. 12 - Prob. 43CECh. 12 - Prob. 44CECh. 12 - Prob. 45CECh. 12 - Prob. 46CECh. 12 - Prob. 47CECh. 12 - Prob. 48CECh. 12 - Prob. 49CECh. 12 - Prob. 50CECh. 12 - Prob. 51CECh. 12 - Prob. 52CECh. 12 - Prob. 53CECh. 12 - Prob. 54CECh. 12 - Prob. 55CECh. 12 - Prob. 56CECh. 12 - Prob. 57CECh. 12 - Prob. 58CECh. 12 - Prob. 59CECh. 12 - In the following regression, X = weekly pay, Y =...Ch. 12 - Prob. 61CECh. 12 - In the following regression, X = total assets (...Ch. 12 - Prob. 63CECh. 12 - Below are percentages for annual sales growth and...Ch. 12 - Prob. 65CECh. 12 - Prob. 66CECh. 12 - Prob. 67CECh. 12 - Simple regression was employed to establish the...Ch. 12 - Prob. 69CECh. 12 - Prob. 70CECh. 12 - Prob. 71CECh. 12 - Below are revenue and profit (both in billions)...Ch. 12 - Below are fitted regressions based on used vehicle...Ch. 12 - Below are results of a regression of Y = average...
Knowledge Booster


Learn more about
Need a deep-dive on the concept behind this application? Look no further. Learn more about this topic, statistics and related others by exploring similar questions and additional content below.Similar questions
- Find the critical value for a left-tailed test using the F distribution with a 0.025, degrees of freedom in the numerator=12, and degrees of freedom in the denominator = 50. A portion of the table of critical values of the F-distribution is provided. Click the icon to view the partial table of critical values of the F-distribution. What is the critical value? (Round to two decimal places as needed.)arrow_forwardA retail store manager claims that the average daily sales of the store are $1,500. You aim to test whether the actual average daily sales differ significantly from this claimed value. You can provide your answer by inserting a text box and the answer must include: Null hypothesis, Alternative hypothesis, Show answer (output table/summary table), and Conclusion based on the P value. Showing the calculation is a must. If calculation is missing,so please provide a step by step on the answers Numerical answers in the yellow cellsarrow_forwardShow all workarrow_forward
- Show all workarrow_forwardplease find the answers for the yellows boxes using the information and the picture belowarrow_forwardA marketing agency wants to determine whether different advertising platforms generate significantly different levels of customer engagement. The agency measures the average number of daily clicks on ads for three platforms: Social Media, Search Engines, and Email Campaigns. The agency collects data on daily clicks for each platform over a 10-day period and wants to test whether there is a statistically significant difference in the mean number of daily clicks among these platforms. Conduct ANOVA test. You can provide your answer by inserting a text box and the answer must include: also please provide a step by on getting the answers in excel Null hypothesis, Alternative hypothesis, Show answer (output table/summary table), and Conclusion based on the P value.arrow_forward
arrow_back_ios
SEE MORE QUESTIONS
arrow_forward_ios
Recommended textbooks for you
 Algebra & Trigonometry with Analytic GeometryAlgebraISBN:9781133382119Author:SwokowskiPublisher:Cengage
 Trigonometry (MindTap Course List)TrigonometryISBN:9781337278461Author:Ron LarsonPublisher:Cengage Learning
 Linear Algebra: A Modern IntroductionAlgebraISBN:9781285463247Author:David PoolePublisher:Cengage Learning
 Algebra: Structure And Method, Book 1AlgebraISBN:9780395977224Author:Richard G. Brown, Mary P. Dolciani, Robert H. Sorgenfrey, William L. ColePublisher:McDougal Littell
 Big Ideas Math A Bridge To Success Algebra 1: Stu...AlgebraISBN:9781680331141Author:HOUGHTON MIFFLIN HARCOURTPublisher:Houghton Mifflin Harcourt
Algebra & Trigonometry with Analytic Geometry
Algebra
ISBN:9781133382119
Author:Swokowski
Publisher:Cengage
Trigonometry (MindTap Course List)
Trigonometry
ISBN:9781337278461
Author:Ron Larson
Publisher:Cengage Learning
Linear Algebra: A Modern Introduction
Algebra
ISBN:9781285463247
Author:David Poole
Publisher:Cengage Learning
Algebra: Structure And Method, Book 1
Algebra
ISBN:9780395977224
Author:Richard G. Brown, Mary P. Dolciani, Robert H. Sorgenfrey, William L. Cole
Publisher:McDougal Littell
Big Ideas Math A Bridge To Success Algebra 1: Stu...
Algebra
ISBN:9781680331141
Author:HOUGHTON MIFFLIN HARCOURT
Publisher:Houghton Mifflin Harcourt
What is a Linear Equation in One Variable?; Author: Don't Memorise;https://www.youtube.com/watch?v=lDOYdBgtnjY;License: Standard YouTube License, CC-BY
Linear Equation | Solving Linear Equations | What is Linear Equation in one variable ?; Author: Najam Academy;https://www.youtube.com/watch?v=tHm3X_Ta_iE;License: Standard YouTube License, CC-BY