
Essentials Of Statistics For Business & Economics
9th Edition
ISBN: 9780357045435
Author: David R. Anderson, Dennis J. Sweeney, Thomas A. Williams, Jeffrey D. Camm, James J. Cochran
Publisher: South-Western College Pub
expand_more
expand_more
format_list_bulleted
Concept explainers
Videos
Textbook Question
Chapter 12.3, Problem 24E
Traffic Accidents by Day of Week. The National Highway Traffic Safety Administration reported the percentage of traffic accidents occurring each day of the week. Assume that a sample of 420 accidents provided the following data.
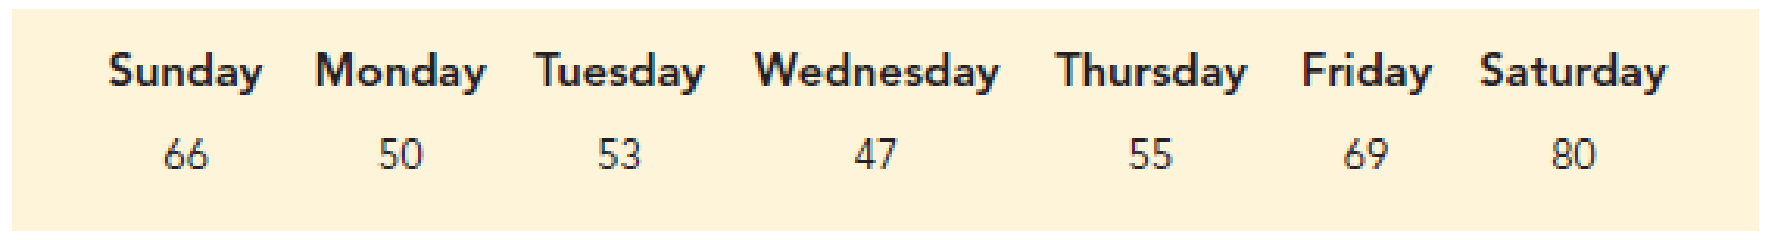
- a. Conduct a hypothesis test to determine if the proportion of traffic accidents is the same for each day of the week. What is the p-value? Using a .05 level of significance, what is your conclusion?
- b. Compute the percentage of traffic accidents occurring on each day of the week. What day has the highest percentage of traffic accidents? Does this seem reasonable? Discuss.
Expert Solution & Answer
Want to see the full answer?
Check out a sample textbook solution
Students have asked these similar questions
08:34
◄ Classroom
07:59
Probs. 5-32/33
D
ا.
89
5-34. Determine the horizontal and vertical components
of reaction at the pin A and the normal force at the smooth
peg B on the member.
A
0,4 m
0.4 m
Prob. 5-34
F=600 N
fr
th
ar
0.
163586
5-37. The wooden plank resting between the buildings
deflects slightly when it supports the 50-kg boy. This
deflection causes a triangular distribution of load at its ends.
having maximum intensities of w, and wg. Determine w
and wg. each measured in N/m. when the boy is standing
3 m from one end as shown. Neglect the mass of the plank.
0.45 m
3 m
Examine the Variables: Carefully review and note the names of all variables in the dataset. Examples of these variables include:
Mileage (mpg)
Number of Cylinders (cyl)
Displacement (disp)
Horsepower (hp)
Research: Google to understand these variables.
Statistical Analysis: Select mpg variable, and perform the following statistical tests. Once you are done with these tests using mpg variable, repeat the same with hp
Mean
Median
First Quartile (Q1)
Second Quartile (Q2)
Third Quartile (Q3)
Fourth Quartile (Q4)
10th Percentile
70th Percentile
Skewness
Kurtosis
Document Your Results:
In RStudio: Before running each statistical test, provide a heading in the format shown at the bottom. “# Mean of mileage – Your name’s command”
In Microsoft Word: Once you've completed all tests, take a screenshot of your results in RStudio and paste it into a Microsoft Word document. Make sure that snapshots are very clear. You will need multiple snapshots. Also transfer these results to the…
Chapter 12 Solutions
Essentials Of Statistics For Business & Economics
Ch. 12.1 - Use the sample data below to test the...Ch. 12.1 - reconsider the observed frequencies in exercise 1...Ch. 12.1 - Late Flight Comparison Across Airlines. The sample...Ch. 12.1 - Electronic Component Supplier Quality Comparison....Ch. 12.1 - Research Classification of Higher Education. The...Ch. 12.1 - Error Rates in Tax Preparation. A tax preparation...Ch. 12.1 - Use of Social Media. Social media is becoming more...Ch. 12.1 - Supplier Quality: Three Inspection Outcomes. The...Ch. 12.2 - The following table contains observed frequencies...Ch. 12.2 - The following table contains observed frequencies...
Ch. 12.2 - Airline Ticket Purchases for Domestic and...Ch. 12.2 - Hiring and Firing Plans at Private and Public...Ch. 12.2 - Generational Differences in Workplace Attitudes....Ch. 12.2 - Vehicle Quality Ratings. A J. D. Power and...Ch. 12.2 - Company Reputation and Management Quality Survey....Ch. 12.2 - Academy Awards and Movie Fan Sentiment. The race...Ch. 12.2 - Amount of Sleep by Age Group. The National Sleep...Ch. 12.2 - Prob. 18ECh. 12.3 - Test the following hypotheses by using the 2...Ch. 12.3 - The following data are believed to have come from...Ch. 12.3 - Television Audiences Across Networks. During the...Ch. 12.3 - M&M Candy Colors. Mars, Inc. manufactures M&M’s,...Ch. 12.3 - Shareholder Scoreboard Ratings. The Wall Street...Ch. 12.3 - Traffic Accidents by Day of Week. The National...Ch. 12.3 - Daily High Temperatures. Bob Feller, an Iowa...Ch. 12.3 - Weekly Demand at Whole Foods Market. The manager...Ch. 12 - Where Millionaires Live in America. In a 2018...Ch. 12 - Quality Comparison Across Production Shifts....Ch. 12 - Ratings of Most-Visited Art Museums. As listed by...Ch. 12 - Pace-of-Life Preference By Gender. A Pew Research...Ch. 12 - Church Attendance by Age Group. The Barna Group...Ch. 12 - Ambulance Calls by Day of Week. An ambulance...Ch. 12 - Attitudes Toward New Nuclear Power Plants. A...Ch. 12 - America’s Favorite Sports. The Harris Poll tracks...Ch. 12 - Best-Selling Small Cars in America. Based on 2017...Ch. 12 - Prob. 36SECh. 12 - Testing If Daily Sales Obey a Binomial Probability...Ch. 12 - In a study conducted by Zogby International for...Ch. 12 - Six months ago, Fuentes Salty Snacks, Inc., added...Ch. 12 - Fresno Board Games manufactures and sells several...
Knowledge Booster


Learn more about
Need a deep-dive on the concept behind this application? Look no further. Learn more about this topic, statistics and related others by exploring similar questions and additional content below.Similar questions
- Examine the Variables: Carefully review and note the names of all variables in the dataset. Examples of these variables include: Mileage (mpg) Number of Cylinders (cyl) Displacement (disp) Horsepower (hp) Research: Google to understand these variables. Statistical Analysis: Select mpg variable, and perform the following statistical tests. Once you are done with these tests using mpg variable, repeat the same with hp Mean Median First Quartile (Q1) Second Quartile (Q2) Third Quartile (Q3) Fourth Quartile (Q4) 10th Percentile 70th Percentile Skewness Kurtosis Document Your Results: In RStudio: Before running each statistical test, provide a heading in the format shown at the bottom. “# Mean of mileage – Your name’s command” In Microsoft Word: Once you've completed all tests, take a screenshot of your results in RStudio and paste it into a Microsoft Word document. Make sure that snapshots are very clear. You will need multiple snapshots. Also transfer these results to the…arrow_forward2 (VaR and ES) Suppose X1 are independent. Prove that ~ Unif[-0.5, 0.5] and X2 VaRa (X1X2) < VaRa(X1) + VaRa (X2). ~ Unif[-0.5, 0.5]arrow_forward8 (Correlation and Diversification) Assume we have two stocks, A and B, show that a particular combination of the two stocks produce a risk-free portfolio when the correlation between the return of A and B is -1.arrow_forward
- 9 (Portfolio allocation) Suppose R₁ and R2 are returns of 2 assets and with expected return and variance respectively r₁ and 72 and variance-covariance σ2, 0%½ and σ12. Find −∞ ≤ w ≤ ∞ such that the portfolio wR₁ + (1 - w) R₂ has the smallest risk.arrow_forward7 (Multivariate random variable) Suppose X, €1, €2, €3 are IID N(0, 1) and Y2 Y₁ = 0.2 0.8X + €1, Y₂ = 0.3 +0.7X+ €2, Y3 = 0.2 + 0.9X + €3. = (In models like this, X is called the common factors of Y₁, Y₂, Y3.) Y = (Y1, Y2, Y3). (a) Find E(Y) and cov(Y). (b) What can you observe from cov(Y). Writearrow_forward1 (VaR and ES) Suppose X ~ f(x) with 1+x, if 0> x > −1 f(x) = 1−x if 1 x > 0 Find VaRo.05 (X) and ES0.05 (X).arrow_forward
- Joy is making Christmas gifts. She has 6 1/12 feet of yarn and will need 4 1/4 to complete our project. How much yarn will she have left over compute this solution in two different ways arrow_forwardSolve for X. Explain each step. 2^2x • 2^-4=8arrow_forwardOne hundred people were surveyed, and one question pertained to their educational background. The results of this question and their genders are given in the following table. Female (F) Male (F′) Total College degree (D) 30 20 50 No college degree (D′) 30 20 50 Total 60 40 100 If a person is selected at random from those surveyed, find the probability of each of the following events.1. The person is female or has a college degree. Answer: equation editor Equation Editor 2. The person is male or does not have a college degree. Answer: equation editor Equation Editor 3. The person is female or does not have a college degree.arrow_forward
arrow_back_ios
SEE MORE QUESTIONS
arrow_forward_ios
Recommended textbooks for you
 Glencoe Algebra 1, Student Edition, 9780079039897...AlgebraISBN:9780079039897Author:CarterPublisher:McGraw Hill
 Big Ideas Math A Bridge To Success Algebra 1: Stu...AlgebraISBN:9781680331141Author:HOUGHTON MIFFLIN HARCOURTPublisher:Houghton Mifflin Harcourt
 Holt Mcdougal Larson Pre-algebra: Student Edition...AlgebraISBN:9780547587776Author:HOLT MCDOUGALPublisher:HOLT MCDOUGAL
Glencoe Algebra 1, Student Edition, 9780079039897...
Algebra
ISBN:9780079039897
Author:Carter
Publisher:McGraw Hill
Big Ideas Math A Bridge To Success Algebra 1: Stu...
Algebra
ISBN:9781680331141
Author:HOUGHTON MIFFLIN HARCOURT
Publisher:Houghton Mifflin Harcourt
Holt Mcdougal Larson Pre-algebra: Student Edition...
Algebra
ISBN:9780547587776
Author:HOLT MCDOUGAL
Publisher:HOLT MCDOUGAL
Hypothesis Testing - Solving Problems With Proportions; Author: The Organic Chemistry Tutor;https://www.youtube.com/watch?v=76VruarGn2Q;License: Standard YouTube License, CC-BY
Hypothesis Testing and Confidence Intervals (FRM Part 1 – Book 2 – Chapter 5); Author: Analystprep;https://www.youtube.com/watch?v=vth3yZIUlGQ;License: Standard YouTube License, CC-BY