
Essentials Of Statistics For Business & Economics
9th Edition
ISBN: 9780357045435
Author: David R. Anderson, Dennis J. Sweeney, Thomas A. Williams, Jeffrey D. Camm, James J. Cochran
Publisher: South-Western College Pub
expand_more
expand_more
format_list_bulleted
Concept explainers
Videos
Textbook Question
Chapter 12.2, Problem 14E
Vehicle Quality Ratings. A J. D. Power and Associates vehicle quality survey asked new owners a variety of questions about their recently purchased automobile. One question asked for the owner’s rating of the vehicle using categorical responses of average, outstanding, and exceptional. Another question asked for the owner’s education level with the categorical responses some high school, high school graduate, some college, and college graduate. Assume the sample data below are for 500 owners who had recently purchased an automobile.
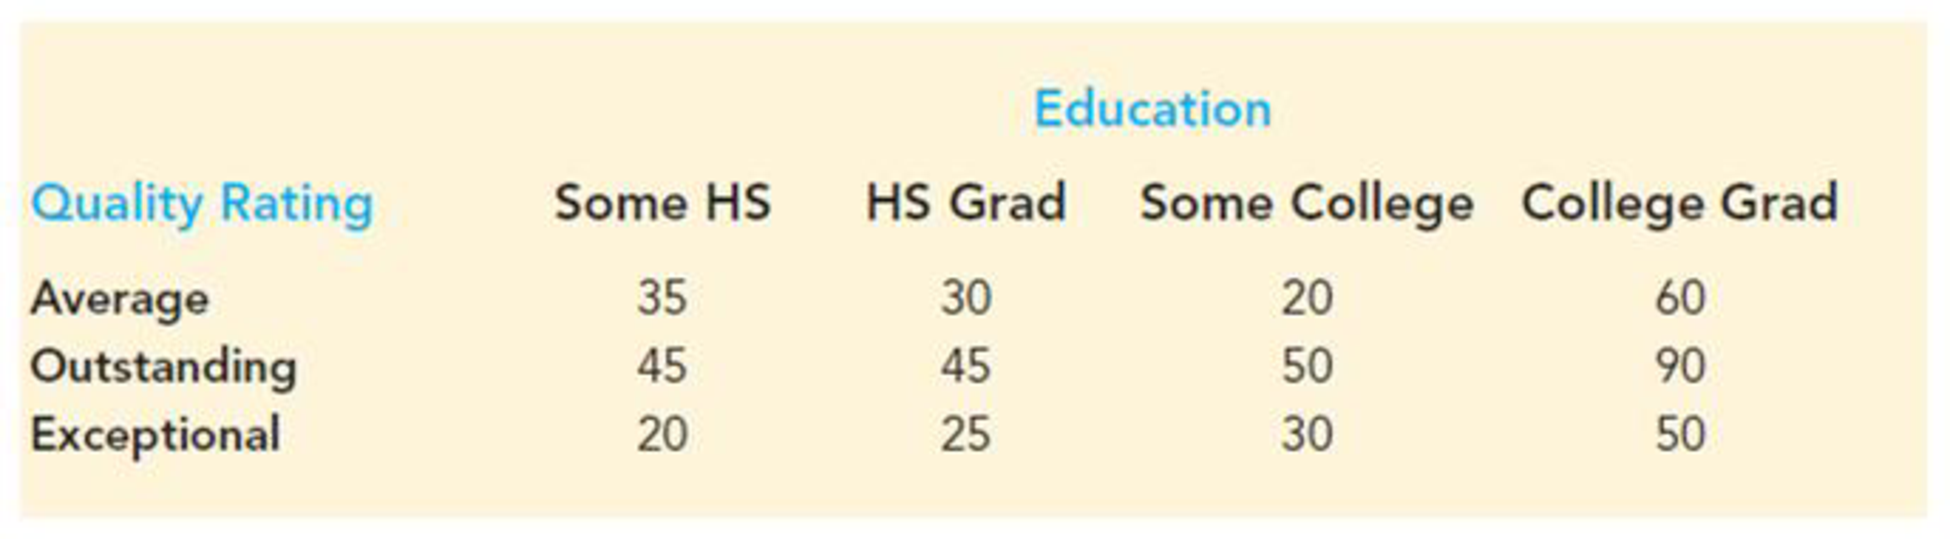
- a. Use a .05 level of significance and a test of independence to determine if a new owner’s vehicle quality rating is independent of the owner’s education. What is the p-value and what is your conclusion?
- b. Use the overall percentage of average, outstanding, and exceptional ratings to comment upon how new owners rate the quality of their recently purchased automobiles.
Expert Solution & Answer

Trending nowThis is a popular solution!

Students have asked these similar questions
Please provide the solution for the attached image in detailed.
20 km, because
GISS
Worksheet 10
Jesse runs a small business selling and delivering mealie meal to the spaza shops.
He charges a fixed rate of R80, 00 for delivery and then R15, 50 for each packet of
mealle meal he delivers. The table below helps him to calculate what to charge
his customers.
10
20
30
40
50
Packets of mealie
meal (m)
Total costs in Rands
80
235
390
545
700
855
(c)
10.1.
Define the following terms:
10.1.1. Independent Variables
10.1.2. Dependent Variables
10.2.
10.3.
10.4.
10.5.
Determine the independent and dependent variables.
Are the variables in this scenario discrete or continuous values? Explain
What shape do you expect the graph to be? Why?
Draw a graph on the graph provided to represent the information in the
table above.
TOTAL COST OF PACKETS OF MEALIE MEAL
900
800
700
600
COST (R)
500
400
300
200
100
0
10
20
30
40
60
NUMBER OF PACKETS OF MEALIE MEAL
Let X be a random variable with support SX = {−3, 0.5, 3, −2.5, 3.5}. Part ofits probability mass function (PMF) is given bypX(−3) = 0.15, pX(−2.5) = 0.3, pX(3) = 0.2, pX(3.5) = 0.15.(a) Find pX(0.5).(b) Find the cumulative distribution function (CDF), FX(x), of X.1(c) Sketch the graph of FX(x).
Chapter 12 Solutions
Essentials Of Statistics For Business & Economics
Ch. 12.1 - Use the sample data below to test the...Ch. 12.1 - reconsider the observed frequencies in exercise 1...Ch. 12.1 - Late Flight Comparison Across Airlines. The sample...Ch. 12.1 - Electronic Component Supplier Quality Comparison....Ch. 12.1 - Research Classification of Higher Education. The...Ch. 12.1 - Error Rates in Tax Preparation. A tax preparation...Ch. 12.1 - Use of Social Media. Social media is becoming more...Ch. 12.1 - Supplier Quality: Three Inspection Outcomes. The...Ch. 12.2 - The following table contains observed frequencies...Ch. 12.2 - The following table contains observed frequencies...
Ch. 12.2 - Airline Ticket Purchases for Domestic and...Ch. 12.2 - Hiring and Firing Plans at Private and Public...Ch. 12.2 - Generational Differences in Workplace Attitudes....Ch. 12.2 - Vehicle Quality Ratings. A J. D. Power and...Ch. 12.2 - Company Reputation and Management Quality Survey....Ch. 12.2 - Academy Awards and Movie Fan Sentiment. The race...Ch. 12.2 - Amount of Sleep by Age Group. The National Sleep...Ch. 12.2 - Prob. 18ECh. 12.3 - Test the following hypotheses by using the 2...Ch. 12.3 - The following data are believed to have come from...Ch. 12.3 - Television Audiences Across Networks. During the...Ch. 12.3 - M&M Candy Colors. Mars, Inc. manufactures M&M’s,...Ch. 12.3 - Shareholder Scoreboard Ratings. The Wall Street...Ch. 12.3 - Traffic Accidents by Day of Week. The National...Ch. 12.3 - Daily High Temperatures. Bob Feller, an Iowa...Ch. 12.3 - Weekly Demand at Whole Foods Market. The manager...Ch. 12 - Where Millionaires Live in America. In a 2018...Ch. 12 - Quality Comparison Across Production Shifts....Ch. 12 - Ratings of Most-Visited Art Museums. As listed by...Ch. 12 - Pace-of-Life Preference By Gender. A Pew Research...Ch. 12 - Church Attendance by Age Group. The Barna Group...Ch. 12 - Ambulance Calls by Day of Week. An ambulance...Ch. 12 - Attitudes Toward New Nuclear Power Plants. A...Ch. 12 - America’s Favorite Sports. The Harris Poll tracks...Ch. 12 - Best-Selling Small Cars in America. Based on 2017...Ch. 12 - Prob. 36SECh. 12 - Testing If Daily Sales Obey a Binomial Probability...Ch. 12 - In a study conducted by Zogby International for...Ch. 12 - Six months ago, Fuentes Salty Snacks, Inc., added...Ch. 12 - Fresno Board Games manufactures and sells several...
Knowledge Booster


Learn more about
Need a deep-dive on the concept behind this application? Look no further. Learn more about this topic, statistics and related others by exploring similar questions and additional content below.Similar questions
- A well-known company predominantly makes flat pack furniture for students. Variability with the automated machinery means the wood components are cut with a standard deviation in length of 0.45 mm. After they are cut the components are measured. If their length is more than 1.2 mm from the required length, the components are rejected. a) Calculate the percentage of components that get rejected. b) In a manufacturing run of 1000 units, how many are expected to be rejected? c) The company wishes to install more accurate equipment in order to reduce the rejection rate by one-half, using the same ±1.2mm rejection criterion. Calculate the maximum acceptable standard deviation of the new process.arrow_forward5. Let X and Y be independent random variables and let the superscripts denote symmetrization (recall Sect. 3.6). Show that (X + Y) X+ys.arrow_forward8. Suppose that the moments of the random variable X are constant, that is, suppose that EX" =c for all n ≥ 1, for some constant c. Find the distribution of X.arrow_forward
- 9. The concentration function of a random variable X is defined as Qx(h) = sup P(x ≤ X ≤x+h), h>0. Show that, if X and Y are independent random variables, then Qx+y (h) min{Qx(h). Qr (h)).arrow_forward10. Prove that, if (t)=1+0(12) as asf->> O is a characteristic function, then p = 1.arrow_forward9. The concentration function of a random variable X is defined as Qx(h) sup P(x ≤x≤x+h), h>0. (b) Is it true that Qx(ah) =aQx (h)?arrow_forward
- 3. Let X1, X2,..., X, be independent, Exp(1)-distributed random variables, and set V₁₁ = max Xk and W₁ = X₁+x+x+ Isk≤narrow_forward7. Consider the function (t)=(1+|t|)e, ER. (a) Prove that is a characteristic function. (b) Prove that the corresponding distribution is absolutely continuous. (c) Prove, departing from itself, that the distribution has finite mean and variance. (d) Prove, without computation, that the mean equals 0. (e) Compute the density.arrow_forward1. Show, by using characteristic, or moment generating functions, that if fx(x) = ½ex, -∞0 < x < ∞, then XY₁ - Y2, where Y₁ and Y2 are independent, exponentially distributed random variables.arrow_forward
- 1. Show, by using characteristic, or moment generating functions, that if 1 fx(x): x) = ½exarrow_forward1990) 02-02 50% mesob berceus +7 What's the probability of getting more than 1 head on 10 flips of a fair coin?arrow_forward9. The concentration function of a random variable X is defined as Qx(h) sup P(x≤x≤x+h), h>0. = x (a) Show that Qx+b(h) = Qx(h).arrow_forward
arrow_back_ios
SEE MORE QUESTIONS
arrow_forward_ios
Recommended textbooks for you
 Glencoe Algebra 1, Student Edition, 9780079039897...AlgebraISBN:9780079039897Author:CarterPublisher:McGraw Hill
 Big Ideas Math A Bridge To Success Algebra 1: Stu...AlgebraISBN:9781680331141Author:HOUGHTON MIFFLIN HARCOURTPublisher:Houghton Mifflin Harcourt
 Holt Mcdougal Larson Pre-algebra: Student Edition...AlgebraISBN:9780547587776Author:HOLT MCDOUGALPublisher:HOLT MCDOUGAL
Glencoe Algebra 1, Student Edition, 9780079039897...
Algebra
ISBN:9780079039897
Author:Carter
Publisher:McGraw Hill
Big Ideas Math A Bridge To Success Algebra 1: Stu...
Algebra
ISBN:9781680331141
Author:HOUGHTON MIFFLIN HARCOURT
Publisher:Houghton Mifflin Harcourt
Holt Mcdougal Larson Pre-algebra: Student Edition...
Algebra
ISBN:9780547587776
Author:HOLT MCDOUGAL
Publisher:HOLT MCDOUGAL
Sampling Methods and Bias with Surveys: Crash Course Statistics #10; Author: CrashCourse;https://www.youtube.com/watch?v=Rf-fIpB4D50;License: Standard YouTube License, CC-BY
Statistics: Sampling Methods; Author: Mathispower4u;https://www.youtube.com/watch?v=s6ApdTvgvOs;License: Standard YouTube License, CC-BY