
Videos
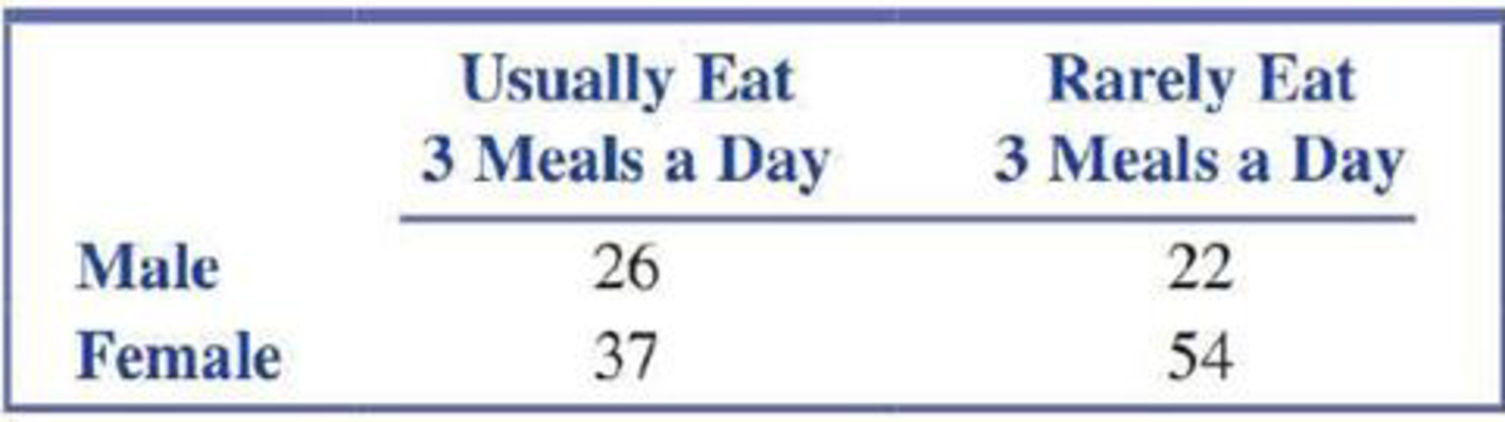
The data summarized in the accompanying table are from the paper “Gender Differences in Food Selections of Students at a Historically Black College and University” (College Student Journal [2009]: 800–806). Suppose that the data resulted from classifying each person in a random sample of 48 male students and each person in a random sample of 91 female students at a particular college according to their response to a question about whether they usually eat three meals a day or rarely eat three meals a day.
- a. Is there evidence that the proportions falling into each of the two response categories are not the same for males and females? Use the X2 statistic to test the relevant hypotheses with a significance level of 0.05.
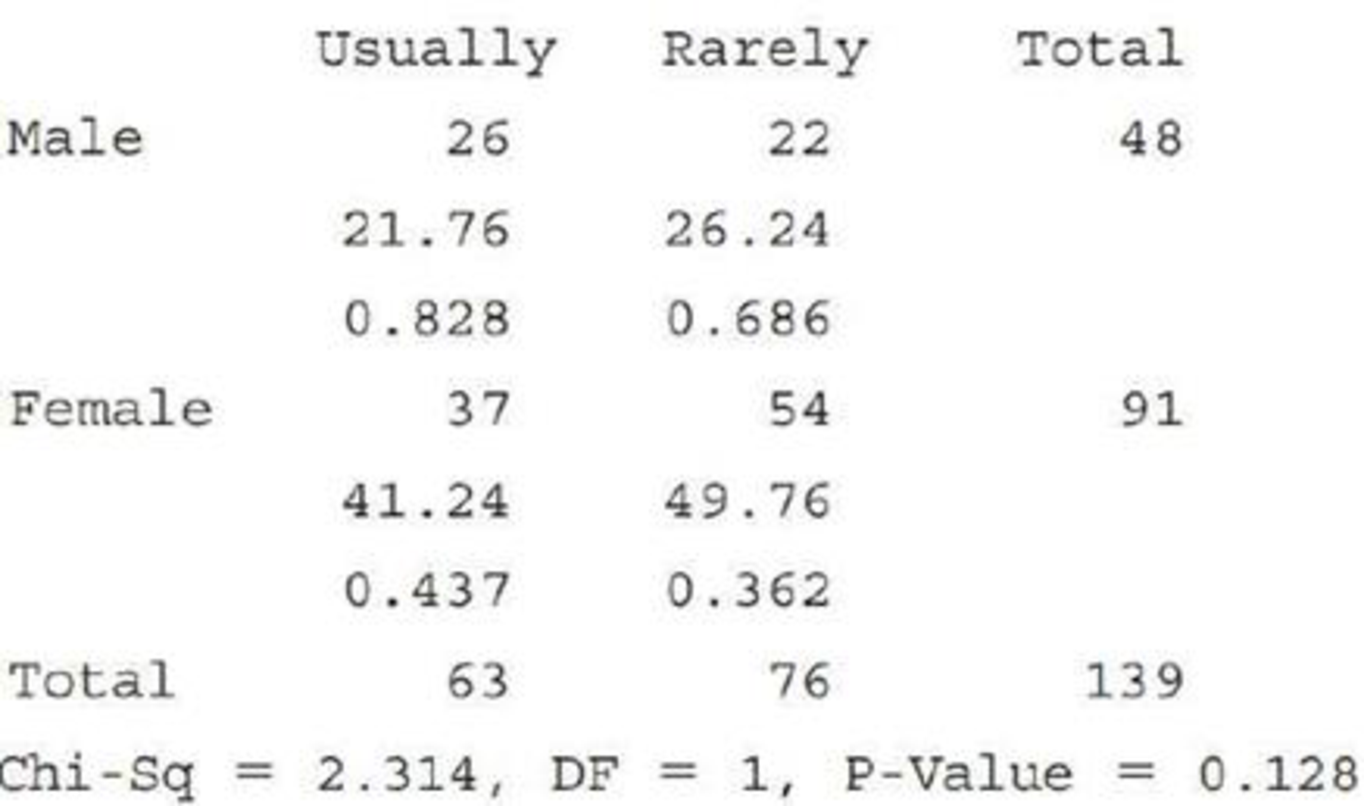
- b. Are the calculations and conclusions from Part (a) consistent with the accompanying Minitab output?
Expected counts are printed below observed counts
Chi-Square contributions are printed below expected counts
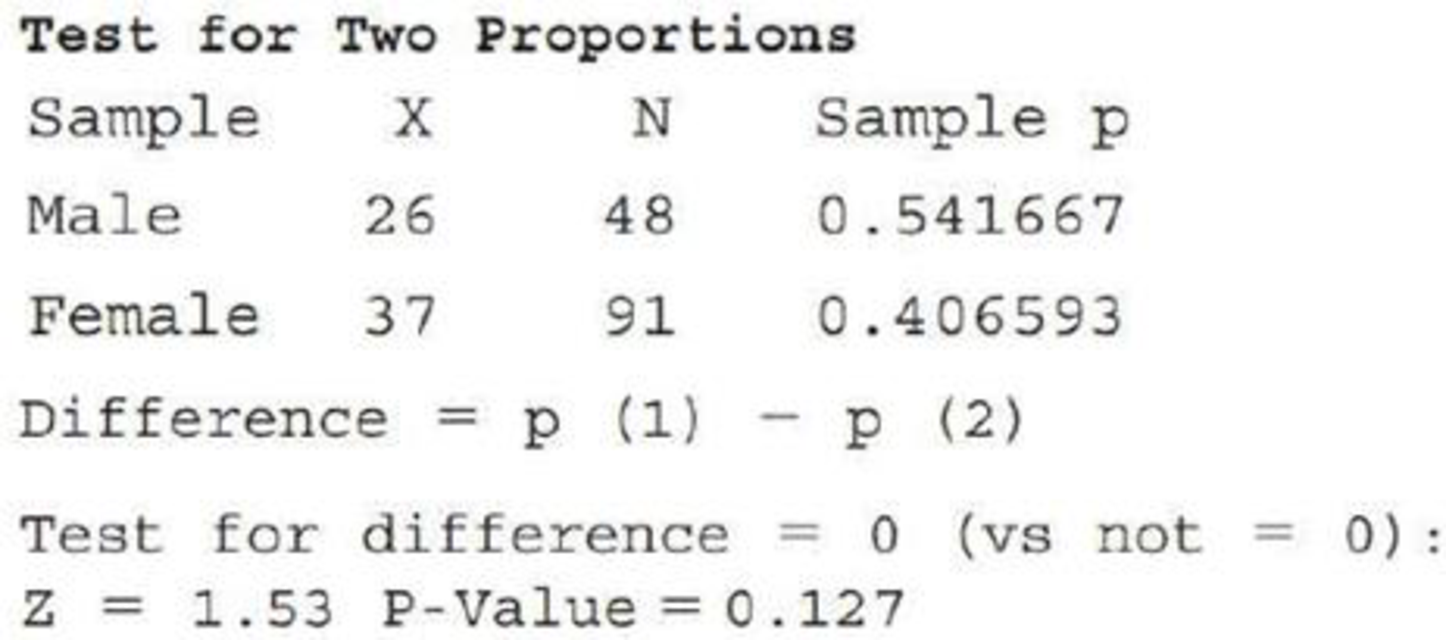
- c. Because the response variable in this exercise has only two categories (usually and rarely), we could have also answered the question posed in Part (a) by carrying out a two-sample z test of H0: p1 − p2 = 0 versus Ha: p1 − p2 ≠ 0, where p1 is the proportion who usually eat three meals a day for males and p2 is the proportion who usually eat three meals a day for females. Minitab output from the two-sample z test is shown below. Using a significance level of 0.05, does the two-sample z test lead to the same conclusion as in Part (a)?
- d. How do the P-values from the tests in Parts (a) and (c) compare? Is this surprising? Explain.
a.
Test whether the proportions falling into each of the two response categories for males and females are same or not.
Answer to Problem 25E
There is no convincing evidence that the proportions falling into each of the two response categories for males and females are not same.
Explanation of Solution
Given table represents classification of male and female students according to their response about whether they usually eat three meals a day or rarely eat three meals a day.
In order to test the proportions falling into each of the two response categories for males and females are same or not, the appropriate test is
The steps in chi-square test for homogeneity is as follows.
Null and alternative Hypotheses:
Null hypothesis:
Alternative hypothesis:
Level of significance:
Assumptions:
- It is given that data resulted from classifying each person in a random sample of male and female students at a particular college.
- The expected cell counts are calculated as shown below.
| Usually eat 3 meals a day | Rarely eat 3 meals a day | Total | |
| Male | 48 | ||
| Female | 91 | ||
| Total | 63 | 76 | 139 |
From the expected cell counts table, it is observed that all the expected counts are greater than 5.
Test Statistic:
Chi-square statistic:
Degrees of freedom:
Here, number of rows is 2 and the number of columns is 2. The degrees of freedom is calculated as follows.
From the calculations,
P-value:
From Table 8-Upper-Tail Areas for Chi-Square Distributions, the Right-tail area is greater than 0.100 for the chi-squared values that are less than 2.70.
Thus, P-value > 0.100.
Decision rule:
- If P-value is less than or equal to the level of significance, reject the null hypothesis.
- Otherwise fail to reject the null hypothesis.
Conclusion:
Here the level of significance is 0.05.
Here, P-value is greater than the level of significance.
That is,
Therefore, fail to reject the null hypothesis. Therefore, there is no convincing evidence that the proportions falling into each of the two response categories for males and females are not same.
b.
Check whether the calculations and conclusions from Part (a) consistent with the accompanying Minitab output.
Explanation of Solution
From Part (a), the chi-square value obtained is
In the given MINITAB output, chi-square value is 2.314 and P-value is 0.128.
Since,
Hence, the calculations and conclusions from Part (a) consistent with the accompanying Minitab output.
c.
Check whether the two-sample z test lead to the same conclusion as in Part (a).
Answer to Problem 25E
The two-sample z test lead to the same conclusion as in Part (a).
Explanation of Solution
From the given output for test for two proportions,
Conclusion:
Here the level of significance is 0.05.
Here, P-value is greater than the level of significance.
That is,
Therefore, fail to reject the null hypothesis. Therefore, there is no convincing evidence that the proportions falling in the two response categories are not same for males and females.
Thus, the two-sample z test lead to the same conclusion as in Part (a).
d.
Explain the comparison of P-values from the tests in Parts (a) and (c).
Explanation of Solution
The P-value obtained in Part (a) is greater than 0.100. And, the P-value obtained in Part (c) is 0.127.
There is some difference in P-value. But both are greater than 0.100.
This is not surprising as both chi-square statistic and z-statistic measure the probability of getting sample proportions that are far from the expected proportions under null hypothesis.
Want to see more full solutions like this?
Chapter 12 Solutions
Introduction To Statistics And Data Analysis


- At the same restaurant as in Question 19 with the same normal distribution, what's the chance of it taking no more than 15 minutes to get service?arrow_forwardClint, obviously not in college, sleeps an average of 8 hours per night with a standard deviation of 15 minutes. What's the chance of him sleeping between 7.5 and 8.5 hours on any given night? 0-(7-0) 200 91109s and doiw $20 (8-0) mol 8520 slang $199 galbrog seam side pide & D (newid se od poyesvig as PELEO PER AFTE editiw noudab temand van Czarrow_forwardTimes to complete a statistics exam have a normal distribution with a mean of 40 minutes and standard deviation of 6 minutes. Deshawn's time comes in at the 90th percentile. What percentage of the students are still working on their exams when Deshawn leaves?arrow_forward
- Suppose that the weights of cereal boxes have a normal distribution with a mean of 20 ounces and standard deviation of half an ounce. A box that has a standard score of o weighs how much? syed by ilog ni 21arrow_forwardBob scores 80 on both his math exam (which has a mean of 70 and standard deviation of 10) and his English exam (which has a mean of 85 and standard deviation of 5). Find and interpret Bob's Z-scores on both exams to let him know which exam (if either) he did bet- ter on. Don't, however, let his parents know; let them think he's just as good at both subjects. algas 70) sering digarrow_forwardSue's math class exam has a mean of 70 with a standard deviation of 5. Her standard score is-2. What's her original exam score?arrow_forward
- Clint sleeps an average of 8 hours per night with a standard deviation of 15 minutes. What's the chance he will sleep less than 7.5 hours tonight? nut bow visarrow_forwardSuppose that your score on an exam is directly at the mean. What's your standard score?arrow_forwardOne state's annual rainfall has a normal dis- tribution with a mean of 100 inches and standard deviation of 25 inches. Suppose that corn grows best when the annual rainfall is between 100 and 150 inches. What's the chance of achieving this amount of rainfall? wved now of sociarrow_forward
- 13 Suppose that your exam score has a standard score of 0.90. Does this mean that 90 percent of the other exam scores are lower than yours?arrow_forwardBob's commuting times to work have a nor- mal distribution with a mean of 45 minutes and standard deviation of 10 minutes. How often does Bob get to work in 30 to 45 minutes?arrow_forwardBob's commuting times to work have a nor- mal distribution with a mean of 45 minutes and standard deviation of 10 minutes. a. What percentage of the time does Bob get to work in 30 minutes or less? b. Bob's workday starts at 9 a.m. If he leaves at 8 a.m., how often is he late?arrow_forward
 Glencoe Algebra 1, Student Edition, 9780079039897...AlgebraISBN:9780079039897Author:CarterPublisher:McGraw Hill
 College Algebra (MindTap Course List)AlgebraISBN:9781305652231Author:R. David Gustafson, Jeff HughesPublisher:Cengage Learning
 Holt Mcdougal Larson Pre-algebra: Student Edition...AlgebraISBN:9780547587776Author:HOLT MCDOUGALPublisher:HOLT MCDOUGAL