
Concept explainers
Videos
The paper “Sociochemosensory and Emotional
One of the three shirts had been worn by the subject’s roommate. The subject was asked to identify the shirt worn by her roommate. This process was then repeated with another three shirts, and the number of times out of the two trials that the subject correctly identified the shirt worn by her roommate was recorded. The resulting data are summarized in the accompanying table.
![Chapter 12.1, Problem 10E, The paper Sociochemosensory and Emotional Functions (Psychological Science [2009]: 11181124)](https://content.bartleby.com/tbms-images/9781337793612/Chapter-12/images/93612-12.1-10e-question-digital_image_001.png)
- a. Can a person identify her roommate by smell? If not, the data from the experiment should be consistent with what we would have expected to see if subjects were just guessing on each trial. That is, we would expect that the probability of selecting the correct shirt would be 1/3 on each of the two trials.
Calculate the proportions of the time we would expect to see 0, 1, and 2 correct identifications if subjects are just guessing. (Hint: 0 correct identifications occurs if the first trial is incorrect and the second trial is incorrect.)
- b. Use the three proportions calculated in Part (a) to carry out a test to determine if the numbers of correct identifications by the students in this study are significantly different from what would have been expected by guessing. Use α = 0.05. (Note: One of the expected counts is just a bit less than 5. For purposes of this exercise, assume that it is OK to proceed with a goodness-of-fit test.)
a.
Calculate the proportion of time expected to see 0, 1, and 2 correct identifications if subjects are just guessing.
Answer to Problem 10E
When the subjects are just guessing, the proportion of time expected to see 0, 1, and 2 correct identifications are
Explanation of Solution
Calculation:
It is given that if subjects were just guessing on each trial, the probability of selecting the correct shirt would be
Thus, the probability of selecting the wrong shirt is
The proportion of 0 correct identifications expected in two trials is shown below.
The proportion of 1 correct identifications expected in two trials is shown below.
The proportion of 2 correct identifications expected in two trials is shown below
b.
Test whether the numbers of correct identifications by the students in this study are significantly different from what would have been expected by guessing at 0.05 level of significance.
Answer to Problem 10E
The numbers of correct identifications by the students in this study are significantly different from those that would have been expected by guessing.
Explanation of Solution
The given data represents the number of correct identifications of shirt worn by her roommate in two trials.
The expected counts can be calculated using the formula,
| Number of correct identification | Observed Frequency | Expected counts |
| 0 | 21 | |
| 1 | 10 | |
| 2 | 13 | |
| Total | 44 | 44 |
The nine step hypotheses testing procedure to test goodness-of-fit is given below.
1. The proportion of correct identifications are
2. Null hypothesis:
3. Alternative hypothesis:
4. Significance level:
5. Test statistic:
6. Assumptions:
- Randomness assumption is not necessary, as the question is only to test whether the observed counts differ from expected by guessing.
- From the table above, it is observed that one of the expected counts is a little less than 5. However, as per the instruction, the goodness-of-fit test can be done.
7. Calculation:
Software procedure:
Step-by-step procedure to obtain the test statistics and P-value using the MINITAB software:
- Choose Stat > Tables > Chi-Square Goodness-of-Fit Test (One Variable).
- In Observed counts, enter the column of Observed count.
- In Category names, enter the column of Number of correct identification.
- Under Test, select the column of Proportion in Proportions specified by historical counts.
- Click OK.
Output using the MINITAB software is given below:
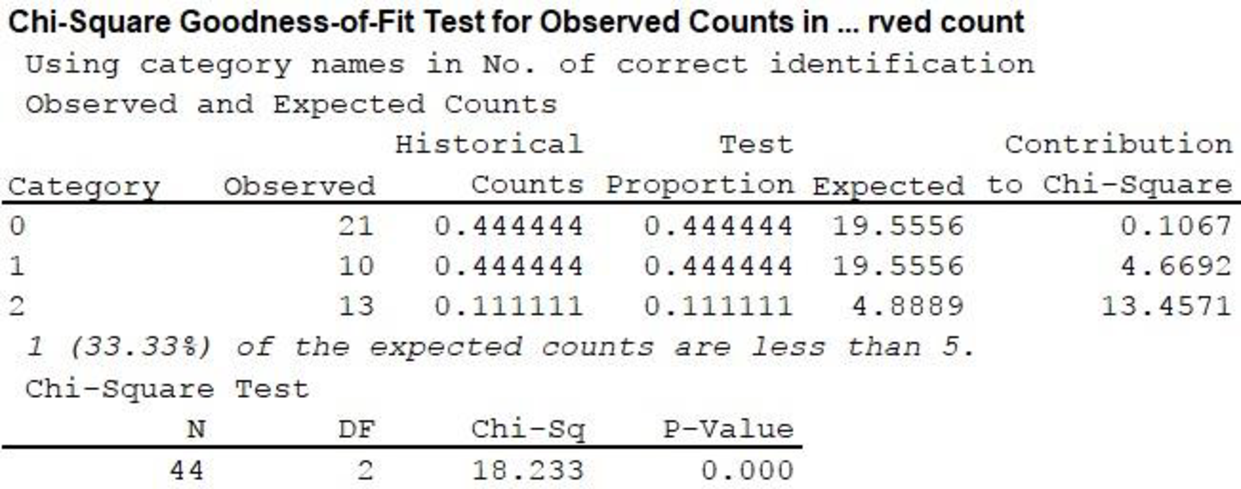
From the output,
8. P-value:
From the MINITAB output,
9. Conclusion:
Decision rule:
- If P-value is less than or equal to the level of significance, reject the null hypothesis.
- Otherwise fail to reject the null hypothesis.
Conclusion:
Here the level of significance is 0.05.
Here, P-value is less than the level of significance.
That is,
Therefore, reject the null hypothesis. Hence, the numbers of correct identifications by the students in this study are significantly different from those that would have been expected by guessing.
Want to see more full solutions like this?
Chapter 12 Solutions
Introduction To Statistics And Data Analysis


- 8. Recall, from Sect. 2.16.4, the likelihood ratio statistic, Ln, which was defined as a product of independent, identically distributed random variables with mean 1 (under the so-called null hypothesis), and the, sometimes more convenient, log-likelihood, log L, which was a sum of independent, identically distributed random variables, which, however, do not have mean log 1 = 0. (a) Verify that the last claim is correct, by proving the more general statement, namely that, if Y is a non-negative random variable with finite mean, then E(log Y) log(EY). (b) Prove that, in fact, there is strict inequality: E(log Y) < log(EY), unless Y is degenerate. (c) Review the proof of Jensen's inequality, Theorem 5.1. Generalize with a glimpse on (b).arrow_forward3. Prove that, for any random variable X, the minimum of E(X - a)² is attained for a = EX. Provedarrow_forward7. Cantelli's inequality. Let X be a random variable with finite variance, o². (a) Prove that, for x ≥ 0, P(X EX2x)≤ 02 x² +0² 202 P(|X - EX2x)<≤ (b) Find X assuming two values where there is equality. (c) When is Cantelli's inequality better than Chebyshev's inequality? (d) Use Cantelli's inequality to show that med (X) - EX ≤ o√√3; recall, from Proposition 6.1, that an application of Chebyshev's inequality yields the bound o√√2. (e) Generalize Cantelli's inequality to moments of order r 1.arrow_forward
- The college hiking club is having a fundraiser to buy new equipment for fall and winter outings. The club is selling Chinese fortune cookies at a price of $2 per cookie. Each cookie contains a piece of paper with a different number written on it. A random drawing will determine which number is the winner of a dinner for two at a local Chinese restaurant. The dinner is valued at $32. Since fortune cookies are donated to the club, we can ignore the cost of the cookies. The club sold 718 cookies before the drawing. Lisa bought 13 cookies. Lisa's expected earnings can be found by multiplying the value of the dinner by the probability that she will win. What are Lisa's expected earnings? Round your answer to the nearest cent.arrow_forwardThe Honolulu Advertiser stated that in Honolulu there was an average of 659 burglaries per 400,000 households in a given year. In the Kohola Drive neighborhood there are 321 homes. Let r be the number of homes that will be burglarized in a year. Use the formula for Poisson distribution. What is the value of p, the probability of success, to four decimal places?arrow_forwardThe college hiking club is having a fundraiser to buy new equipment for fall and winter outings. The club is selling Chinese fortune cookies at a price of $2 per cookie. Each cookie contains a piece of paper with a different number written on it. A random drawing will determine which number is the winner of a dinner for two at a local Chinese restaurant. The dinner is valued at $32. Since fortune cookies are donated to the club, we can ignore the cost of the cookies. The club sold 718 cookies before the drawing. Lisa bought 13 cookies. Lisa's expected earnings can be found by multiplying the value of the dinner by the probability that she will win. What are Lisa's expected earnings? Round your answer to the nearest cent.arrow_forward
- What was the age distribution of nurses in Great Britain at the time of Florence Nightingale? Thanks to Florence Nightingale and the British census of 1851, we have the following information (based on data from the classic text Notes on Nursing, by Florence Nightingale). Note: In 1851 there were 25,466 nurses in Great Britain. Furthermore, Nightingale made a strict distinction between nurses and domestic servants. Use a histogram and graph the probability distribution. Using the graph of the probability distribution determine the probability that a British nurse selected at random in 1851 would be 40 years of age or older. Round your answer to nearest thousandth. Age range (yr) 20–29 30–39 40–49 50–59 60–69 70–79 80+ Midpoint (x) 24.5 34.5 44.5 54.5 64.5 74.5 84.5 Percent of nurses 5.7% 9.7% 19.5% 29.2% 25.0% 9.1% 1.8%arrow_forwardWhat was the age distribution of nurses in Great Britain at the time of Florence Nightingale? Thanks to Florence Nightingale and the British census of 1851, we have the following information (based on data from the classic text Notes on Nursing, by Florence Nightingale). Note: In 1851 there were 25,466 nurses in Great Britain. Furthermore, Nightingale made a strict distinction between nurses and domestic servants. Use a histogram and graph the probability distribution. Using the graph of the probability distribution determine the probability that a British nurse selected at random in 1851 would be 40 years of age or older. Round your answer to nearest thousandth. Age range (yr) 20–29 30–39 40–49 50–59 60–69 70–79 80+ Midpoint (x) 24.5 34.5 44.5 54.5 64.5 74.5 84.5 Percent of nurses 5.7% 9.7% 19.5% 29.2% 25.0% 9.1% 1.8%arrow_forwardThere are 4 radar stations and the probability of a single radar station detecting an enemy plane is 0.55. Make a histogram for the probability distribution.arrow_forward
- show all stepsarrow_forwardMost people know that the probability of getting a head when you flip a fair coin is . You want to use the relative frequency of the event to show that the probability is . How many times should you simulate flipping the coin in the experiment? Would it be better to use 300 trials or 3000 trials? Explain.arrow_forwardThe qualified applicant pool for eight management trainee positions consists of ten women and six men. How many different groups of applicants can be selected for the positionsarrow_forward
 Glencoe Algebra 1, Student Edition, 9780079039897...AlgebraISBN:9780079039897Author:CarterPublisher:McGraw Hill
 Holt Mcdougal Larson Pre-algebra: Student Edition...AlgebraISBN:9780547587776Author:HOLT MCDOUGALPublisher:HOLT MCDOUGAL