
Statistics: The Art and Science of Learning From Data, Books a la Carte Edition (4th Edition)
4th Edition
ISBN: 9780133860825
Author: Alan Agresti, Christine A. Franklin, Bernhard Klingenberg
Publisher: PEARSON
expand_more
expand_more
format_list_bulleted
Concept explainers
Videos
Textbook Question
Chapter 12.2, Problem 19PB
Advertising and sales Each month, the owner of Café Gardens restaurant records y = monthly total sales receipts and x = amount spent that month on advertising, both in thousands of dollars. For the first four months of operation, the observations are as shown in the table. The
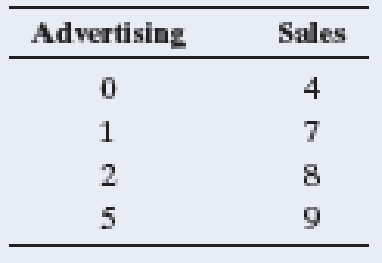
- a. Find the
mean and standard deviation for each variable. - b. Using the formulas for the slope and the y-intercept or software, find the regression line.
- c. The se of the slope estimate is 0.364. Test the null hypothesis that these variables are independent, using a significance level of 0.05.
Expert Solution & Answer
Want to see the full answer?
Check out a sample textbook solution
Students have asked these similar questions
Most people know that the probability of getting a head when you flip a fair coin is . You want to use the relative frequency of the event to show that the probability is . How many times should you simulate flipping the coin in the experiment? Would it be better to use 300 trials or 3000 trials? Explain.
The qualified applicant pool for eight management trainee positions consists of ten women and six men. How many different groups of applicants can be selected for the positions
You want to make a salad from whatever vegetable you have in the fridge. You have seven different tomatoes. There are 2 red tomatoes, 4 yellow tomatoes, and one black tomato in the fridge. You have three different bell peppers. There is 1 red pepper, 1 yellow pepper, and 1 green pepper. What is the probability of randomly choosing a vegetable and getting a red tomato, and a green pepper? Round your answer to four decimal places.
Chapter 12 Solutions
Statistics: The Art and Science of Learning From Data, Books a la Carte Edition (4th Edition)
Ch. 12.1 - Car mileage and weight The Car Weight and Mileage...Ch. 12.1 - Prob. 2PBCh. 12.1 - Predicting maximum bench strength in males For the...Ch. 12.1 - Prob. 4PBCh. 12.1 - Mu, not y For a population regression equation,...Ch. 12.1 - Prob. 6PBCh. 12.1 - Study time and college GPA Exercise 3.39 in...Ch. 12.1 - Prob. 8PBCh. 12.1 - Cell phone specs Refer to the cell phone data set...Ch. 12.1 - Prob. 10PB
Ch. 12.2 - t-score? A regression analysis is conducted with...Ch. 12.2 - Prob. 12PBCh. 12.2 - Confidence interval for slope Refer to the...Ch. 12.2 - Prob. 14PBCh. 12.2 - Strength through leg press The high school female...Ch. 12.2 - Prob. 16PBCh. 12.2 - More girls are good? Repeat the previous exercise...Ch. 12.2 - CI and two-sided tests correspond Refer to the...Ch. 12.2 - Advertising and sales Each month, the owner of Caf...Ch. 12.2 - Prob. 20PBCh. 12.2 - GPA and skipping classrevisited Refer to the...Ch. 12.2 - Prob. 22PBCh. 12.3 - Dollars and thousands of dollars If a slope is...Ch. 12.3 - Prob. 24PBCh. 12.3 - Sketch scatterplot Sketch a scatterplot,...Ch. 12.3 - Prob. 26PBCh. 12.3 - Body fat For the Male Athlete Strength data file...Ch. 12.3 - Prob. 28PBCh. 12.3 - SAT regression toward mean Refer to the previous...Ch. 12.3 - Prob. 30PBCh. 12.3 - GPA and study time Refer to the association you...Ch. 12.3 - Prob. 32PBCh. 12.3 - Does tutoring help? For a class of 100 students,...Ch. 12.3 - Prob. 34PBCh. 12.3 - Golf regression In the first round of a golf...Ch. 12.3 - Prob. 36PBCh. 12.3 - Food and drink sales The owner of Berthas...Ch. 12.3 - Prob. 38PBCh. 12.3 - Violent crime and single-parent families Use...Ch. 12.4 - Poor predicted strengths The MINITAB output shows...Ch. 12.4 - Prob. 42PBCh. 12.4 - Bench press residuals The figure is a histogram of...Ch. 12.4 - Predicting house prices The House Selling Prices...Ch. 12.4 - Predicting clothes purchases For a random sample...Ch. 12.4 - Prob. 46PBCh. 12.4 - ANOVA table for leg press Exercise 12.15 referred...Ch. 12.4 - Prob. 48PBCh. 12.4 - Variability and F Refer to the previous two...Ch. 12.4 - Understanding an ANOVA table For a random sample...Ch. 12.4 - Predicting cell phone weight Refer to the cell...Ch. 12.4 - Cell phone ANOVA Report the ANOVA table for the...Ch. 12.5 - Savings grow exponentially You invest 100 in a...Ch. 12.5 - Prob. 55PBCh. 12.5 - Prob. 56PBCh. 12.5 - Prob. 57PBCh. 12.5 - Prob. 58PBCh. 12.5 - Prob. 59PBCh. 12.5 - Prob. 60PBCh. 12.5 - Prob. 61PBCh. 12 - Prob. 62CPCh. 12 - Prob. 63CPCh. 12 - Prob. 64CPCh. 12 - Prob. 65CPCh. 12 - Prob. 66CPCh. 12 - Prob. 67CPCh. 12 - Prob. 68CPCh. 12 - Prob. 69CPCh. 12 - Prob. 70CPCh. 12 - Prob. 71CPCh. 12 - Prob. 72CPCh. 12 - Prob. 73CPCh. 12 - Prob. 74CPCh. 12 - World population growth The table shows the world...Ch. 12 - Prob. 76CPCh. 12 - Prob. 77CPCh. 12 - Prob. 78CPCh. 12 - Prob. 79CPCh. 12 - Prob. 81CPCh. 12 - Prob. 82CPCh. 12 - Prob. 83CPCh. 12 - Prob. 84CPCh. 12 - Prob. 85CPCh. 12 - Prob. 86CPCh. 12 - Prob. 87CPCh. 12 - Prob. 88CPCh. 12 - Prob. 89CPCh. 12 - Assumptions What assumptions are needed to use the...Ch. 12 - Assumptions fail? Refer to the previous exercise....Ch. 12 - Lots of standard deviations Explain carefully the...Ch. 12 - Decrease in home values A Freddie Mac quarterly...Ch. 12 - Population growth Exercise 12.57 about U.S....Ch. 12 - Multiple choice: Interpret r One can interpret r =...Ch. 12 - Multiple choice: Correlation invalid The...Ch. 12 - Multiple choice: Slope and correlation The slope...Ch. 12 - Multiple choice: Regress x on y The regression of...Ch. 12 - Multiple choice: Income and height University of...Ch. 12 - True or false The variables y = annual income...Ch. 12 - Prob. 101CPCh. 12 - Why is there regression toward the mean? Refer to...Ch. 12 - Prob. 103CPCh. 12 - Prob. 104CPCh. 12 - Prob. 105CPCh. 12 - Prob. 106CP
Knowledge Booster


Learn more about
Need a deep-dive on the concept behind this application? Look no further. Learn more about this topic, statistics and related others by exploring similar questions and additional content below.Similar questions
- uppose automobile insurance companies gave annual premiums for top-rated companies in several states. The figure below shows box plots for the annual premium for urban customers in three states. Which state offers the lowest premium? Which state offers the highest premium?arrow_forwardWing Foot is a shoe franchise commonly found in shopping centers across the United States. Wing Foot knows that its stores will not show a profit unless they gross over $940,000 per year. Let A be the event that a new Wing Foot store grosses over $940,000 its first year. Let B be the event that a store grosses over $940,000 its second year. Wing Foot has an administrative policy of closing a new store if it does not show a profit in either of the first two years. Assume that the accounting office at Wing Foot provided the following information: 58% of all Wing Foot stores show a profit the first year; 72% of all Wing Foot store show a profit the second year (this includes stores that did not show a profit the first year); however, 86% of Wing Foot stores that showed a profit the first year also showed a profit the second year. Compute P(B|Ac). Round your answer to the nearest hundredth.arrow_forwardYou draw two cards from a standard deck of 52 cards, but before you draw the second card, you put the first one back and reshuffle the deck. If you get a3on the first card, find the probability of drawing a 3 for the second card.arrow_forward
- Do bonds reduce the overall risk of an investment portfolio? Let x be a random variable representing annual percent return for the Vanguard Total Stock Index (all Stocks). Let y be a random variable representing annual return for the Vanguard Balanced Index (60% stock and 40% bond). For the past several years, assume the following data. Compute the coefficient of variation for each fund. Round your answers to the nearest tenth. x: 14 0 37 21 35 23 24 -14 -14 -17 y: 8 -2 29 17 22 17 17 -2 -3 -8arrow_forwardWhat percentage of the general U.S. population have bachelor's degrees? Suppose that the Statistical Abstract of the United States, 120th Edition, gives the following percentage of bachelor’s degrees by state. For convenience, the data are sorted in increasing order. 17 18 18 18 19 20 20 20 21 21 21 21 21 22 22 22 22 22 23 23 24 24 24 24 24 25 25 25 25 26 26 26 26 26 26 27 27 27 28 28 28 29 29 31 31 32 32 34 35 38 Illinois has a bachelor's degree percentage rate of about 18%. Into what quartile does this rate fall?arrow_forwardWhat percentage of the general U.S. population have bachelor's degrees? Suppose that the Statistical Abstract of the United States, 120th Edition, gives the following percentage of bachelor’s degrees by state. For convenience, the data are sorted in increasing order. 17 18 18 18 19 20 20 20 21 21 21 21 21 22 22 22 22 22 23 23 24 24 24 24 24 25 25 25 25 26 26 26 26 26 26 27 27 27 28 28 28 29 29 31 31 32 32 34 35 38 Illinois has a bachelor's degree percentage rate of about 18%. Into what quartile does this rate fall?arrow_forward
- Find the range for the following sample data. x 23 17 11 30 27arrow_forwardDo bonds reduce the overall risk of an investment portfolio? Let x be a random variable representing annual percent return for the Vanguard Total Stock Index (all Stocks). Let y be a random variable representing annual return for the Vanguard Balanced Index (60% stock and 40% bond). For the past several years, assume the following data. Compute the sample mean for x and for y. Round your answer to the nearest tenth. x: 11 0 36 22 34 24 25 -11 -11 -22 y: 9 -3 28 14 23 16 14 -3 -4 -9arrow_forwardDo bonds reduce the overall risk of an investment portfolio? Let x be a random variable representing annual percent return for the Vanguard Total Stock Index (all Stocks). Let y be a random variable representing annual return for the Vanguard Balanced Index (60% stock and 40% bond). For the past several years, assume the following data. Compute the range for variable y. X 12 0 36 21 35 23 24 -12 -12 -21 Y 10 -2 26 15 22 18 15 -2 -3 -10arrow_forward
- Do bonds reduce the overall risk of an investment portfolio? Let x be a random variable representing annual percent return for the Vanguard Total Stock Index (all Stocks). Let y be a random variable representing annual return for the Vanguard Balanced Index (60% stock and 40% bond). For the past several years, assume the following data. Compute the range for variable y. X 12 0 36 21 35 23 24 -12 -12 -21 Y 10 -2 26 15 22 18 15 -2 -3 -10arrow_forwardDo bonds reduce the overall risk of an investment portfolio? Let x be a random variable representing annual percent return for the Vanguard Total Stock Index (all Stocks). Let y be a random variable representing annual return for the Vanguard Balanced Index (60% stock and 40% bond). For the past several years, assume the following data. Compute the range for variable x. X 15 0 37 23 33 25 26 -15 -15 -23 Y 6 -1 28 18 24 17 18 -1 -2 -6arrow_forward7.16. If the probability density of X is given by g kx³ for x>0 f(x) = (1+2x)6 0 10-01, elsewhere trolls inf ( 2X density of the random variable Y = where k is an appropriate constant, find the probability 1+2X distribution of Y, and thus determine the value of k. 7 Identify thearrow_forward
arrow_back_ios
SEE MORE QUESTIONS
arrow_forward_ios
Recommended textbooks for you
 Glencoe Algebra 1, Student Edition, 9780079039897...AlgebraISBN:9780079039897Author:CarterPublisher:McGraw Hill
 Functions and Change: A Modeling Approach to Coll...AlgebraISBN:9781337111348Author:Bruce Crauder, Benny Evans, Alan NoellPublisher:Cengage Learning
 Big Ideas Math A Bridge To Success Algebra 1: Stu...AlgebraISBN:9781680331141Author:HOUGHTON MIFFLIN HARCOURTPublisher:Houghton Mifflin Harcourt
 Holt Mcdougal Larson Pre-algebra: Student Edition...AlgebraISBN:9780547587776Author:HOLT MCDOUGALPublisher:HOLT MCDOUGAL
 College Algebra (MindTap Course List)AlgebraISBN:9781305652231Author:R. David Gustafson, Jeff HughesPublisher:Cengage Learning
Glencoe Algebra 1, Student Edition, 9780079039897...
Algebra
ISBN:9780079039897
Author:Carter
Publisher:McGraw Hill
Functions and Change: A Modeling Approach to Coll...
Algebra
ISBN:9781337111348
Author:Bruce Crauder, Benny Evans, Alan Noell
Publisher:Cengage Learning
Big Ideas Math A Bridge To Success Algebra 1: Stu...
Algebra
ISBN:9781680331141
Author:HOUGHTON MIFFLIN HARCOURT
Publisher:Houghton Mifflin Harcourt
Holt Mcdougal Larson Pre-algebra: Student Edition...
Algebra
ISBN:9780547587776
Author:HOLT MCDOUGAL
Publisher:HOLT MCDOUGAL
College Algebra (MindTap Course List)
Algebra
ISBN:9781305652231
Author:R. David Gustafson, Jeff Hughes
Publisher:Cengage Learning
Correlation Vs Regression: Difference Between them with definition & Comparison Chart; Author: Key Differences;https://www.youtube.com/watch?v=Ou2QGSJVd0U;License: Standard YouTube License, CC-BY
Correlation and Regression: Concepts with Illustrative examples; Author: LEARN & APPLY : Lean and Six Sigma;https://www.youtube.com/watch?v=xTpHD5WLuoA;License: Standard YouTube License, CC-BY