Concept explainers
Videos
Use a calculator with an ex key to solve Exercises 57—63. The bar graph shows the percentage of U.S. high school seniors who applied to more than three colleges for selected years from 1980 through 2013.
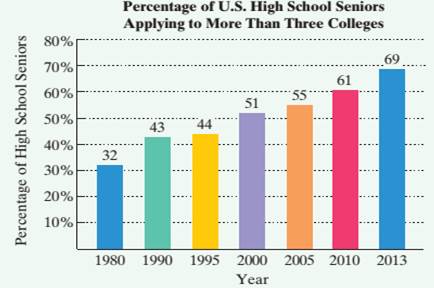
Source: The Higher Education Research Institute
The data in the bar graph at the bottom of the previous page can he modeled by
in which f(x) and g(x) represent the percentage of high school seniors who applied to more than three colleges x years after 1980. Use these functions to solve Exercises 57—58. Where necessary, round answers to the nearest percent.
57. a. According to the linear model, what percentage of high school seniors applied to more than three colleges in 2013?
b. According to the exponential model, what percentage of high school seniors applied to more than three colleges in 2013?
c. Which function is a better model for the data shown by the bar graph in 2013?
58. a. According to the linear model, what percentage of high school seniors applied to more than three colleges in 2010?
b. According to the exponential model, what percentage of high school seniors applied to more than three colleges in 2010?
c. Which function is a better model for the data shown by the bar graph in 2010?
59. In college, we study large volumes of information- information that, unfortunately, we do not often retain for very long. The function
describes the percentage of information, f(x), that a particular person remembers x weeks after learning the information.
a. Substitute 0 for x and, without using a calculator, find the percentage of information remembered at the moment it is first learned.
b. Substitute 1 for x and find the percentage of information that is remembered after 1 week.
c. Find the percentage of information that is remembered after 4 weeks.
d. Find the percentage of information that is remembered after one year (52 weeks).
60. In 1626. Peter Minuit persuaded the Wappinger Indians to sell him Manhattan Island for $24. If the Native Americans had put the $24 into a bank account paying 5% interest, how much would the investment have been worth in the year 2005 if interest were compounded
a. monthly?
b. continuously?
The function
models the percentage, f(x), of people x years old with some
coronary heart disease. Use this function to solve Exercises 61-62. Round answers to the nearest tenth of a percent.
61. Evaluate f(30) and describe what this means in practical terms
62. Evaluate f(70) and describe what this means in practical terms.
63. The function

describes the number of people, N(t), who become ill with influenza t weeks after its initial outbreak in a town with 30,000 inhabitants. The horizontal asymptote in the graph indicates that there is a limit to the epidemic's growth.
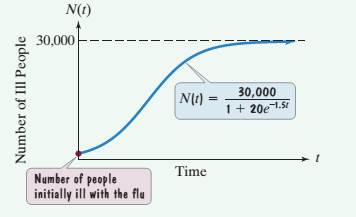
a. How many people became ill with the flu when the epidemic began? (When the epidemic began, t = 0.)
b. How many people were ill by the end of the third week?
c. Why can't the spread of an epidemic simply grow indefinitely? What does the horizontal asymptote shown in the graph indicate about the limiting size of the population that becomes ill?
Want to see the full answer?
Check out a sample textbook solution
Chapter 12 Solutions
Introductory and Intermediate Algebra for College Students (5th Edition)


- 1. Let 15 -14 A = -10 9 13-12 -8 7 11 15 -14 13 -12 -6 and B = -10 9 -8 7 -6 5 -4 3 -2 E 5 -4 3 -2 1 Explicitly give the values of A2,3, A1,5, and B1,4- Is A a 5 x 3 matrix? Explain your answer. Are A and B (mathematically) equal? Explain your answer.arrow_forwardGiven the following set X = {2, 4, 6, 8} and Y = {1, 2, 3}, explicitly give (e.g., write down the sets with numerical entries) of the outputs of the following requested set operations: (a) [2 points] XUY (Union) (b) [2 points] XY (Intersection) (c) [3 points] X\Y (Difference) (d) [3 points] XAY (Symmetric Difference)arrow_forwardFor what values of k will the equation (k + 1)x² + 6kx + 2k² - x = 0 have: a) one root equal zero b) one root the reciprocal of the other c) roots numerically equal but of opposite signarrow_forward
- 1) Find The inverse The domain of m(x) = tion and of the function The inverse function 3- √x-aarrow_forwardGraph the following function. Please also graph the asymptote. Thank you.arrow_forwardFile Edit View History Bookmarks Profiles Tab Window Window Help Things Quadratics! Part 1 X SM◄))) 61% Fri 25 student.desmos.com/activitybuilder/instance/67b739e7356cae7898fd0dbd/student/67b8f115811d42186c239e23#screenid=41a95 ngs Quadratics! Part 1: Parabolas Mitchell 30 30 foo feet 20- 20 10 0 -10 FEB 21 3 10 10 80 FS F3 X Intercepts #2 20 20 Approximately how tall is the shooter? > Which intercept did you use to solve the above problem? x-intercept y-intercept 30 feet Explain your thinking. 1 √E Submit 00000 acBook stv 399 ? DOD 000 F4 % 5 W E R F5 A F6 F7 F9 & * 7 8 9 0 Y U C 014arrow_forward
- The table below shows the acreage, number of visitors, and total revenue of state parks and recreational areas in Massachusetts, New York, and Vermont in 2010. State Acreage (in thousands) Visitors (in thousands) Revenue (in thousands) Massachusetts 350 35,271 $12,644 New York 1,354 56,322 $85,558 Vermont 69 758 $10,969 Select the three true statements based on the data in the table. A. Vermont had the highest revenue per acre of state parks and recreational areas. B. Vermont had approximately 11 visitors per acre of state parks and recreational areas. C. New York had the highest number of visitors per acre of state parks and recreational areas. D. Massachusetts had approximately 36 visitors per acre of state parks and recreational areas. E. New York had revenue of approximately $63.19 per acre of state parks and recreational areas. F. Massachusetts had revenue of approximately $0.03 per acre of state parks and recreational areas.arrow_forwarda) show that the empty set and sigletonset are convex set. 6) show that every sub space of linear space X is convex but the convers heed not be true. c) let Mand N be two convex set of a linear Space X and KEF Show that MUN is conevex and (ii) M-N is convex or hot A and is MSN or NSM show that MUN convex or not, 385arrow_forwardI write with prove one-to-one linear Sanction but not onto Lexample.) b) write with Prove on to linear function but not oh-to-on (example). c) write with prove example x=y St Xandy two linear space over Sielad F.arrow_forward
- Find the sample space. Sunscreen SPF 10, 15, 30, 45, 50 Type Lotion, Spray, Gelarrow_forwardFor each graph below, state whether it represents a function. Graph 1 24y Graph 2 Graph 3 4 2 -8 -6 -4 -2 -2 2 4 6 Function? ○ Yes ○ No ○ Yes ○ No Graph 4 Graph 5 8 Function? Yes No Yes No -2. ○ Yes ○ No Graph 6 4 + 2 4 -8 -6 -4 -2 2 4 6 8 Yes -4++ Noarrow_forwardPractice k Help ises A 96 Anewer The probability that you get a sum of at least 10 is Determine the number of ways that the specified event can occur when two number cubes are rolled. 1. Getting a sum of 9 or 10 3. Getting a sum less than 5 2. Getting a sum of 6 or 7 4. Getting a sum that is odd Tell whether you would use the addition principle or the multiplication principle to determine the total number of possible outcomes for the situation described. 5. Rolling three number cubes 6. Getting a sum of 10 or 12 after rolling three number cubes A set of playing cards contains four groups of cards designated by color (black, red, yellow, and green) with cards numbered from 1 to 14 in each group. Determine the number of ways that the specified event can occur when a card is drawn from the set. 7. Drawing a 13 or 14 9. Drawing a number less than 4 8. Drawing a yellow or green card 10. Drawing a black, red, or green car The spinner is divided into equal parts. Find the specified…arrow_forward
 Algebra & Trigonometry with Analytic GeometryAlgebraISBN:9781133382119Author:SwokowskiPublisher:Cengage