
EBK MATHEMATICS FOR THE TRADES
11th Edition
ISBN: 8220106960455
Author: CARMAN
Publisher: PEARSON
expand_more
expand_more
format_list_bulleted
Concept explainers
Videos
Textbook Question
Chapter 12.1, Problem 4AE
General Interest The following stacked bar graph shows total movie ticket sales worldwide from 2010–2015. The lower section of each bar indicates box-office receipts for the United States and Canada, while the upper section shows the international receipts. The vertical scale is in billions of dollars. Study the graph and answer the questions that follow.
Worldwide Movie Ticket Sales (2010–2015)
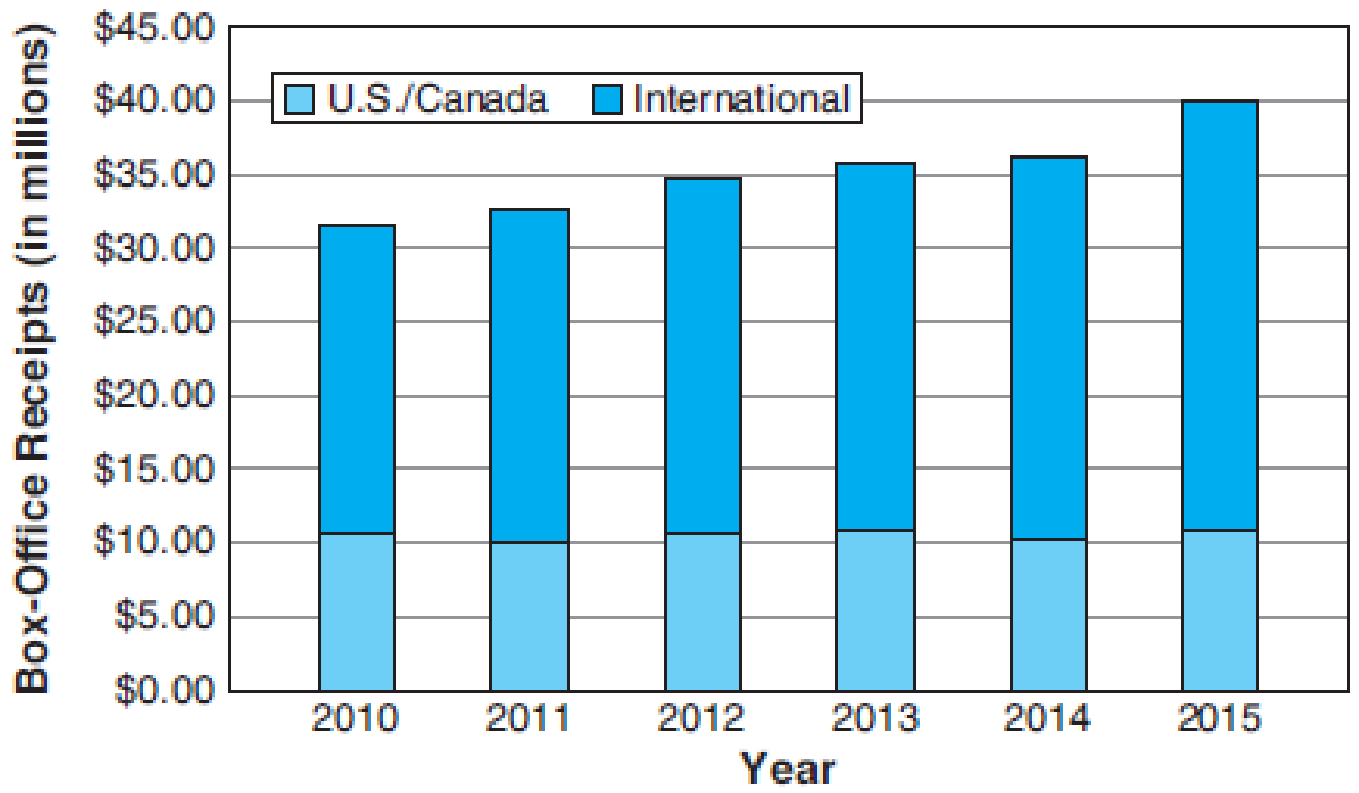
- (a) What does the graph tell you in general about the growth of international ticket sales versus the growth of U.S. and Canadian sales?
- (b) What was the U.S. and Canadian total in 2011?
- (c) What was the international total for 2014?
- (d) By what percent did international ticket sales increase from 2010 to 2015?
- (e) What percent of total ticket sales came from the U.S. and Canada in 2010? In 2015?
Expert Solution & Answer
Want to see the full answer?
Check out a sample textbook solution
Students have asked these similar questions
ex
5.
important aspects.
Graph f(x)=lnx. Be sure to make your graph big enough to easily read (use the space given.) Label all
6
33
Suppose that a room containing 1300 cubic feet of air is originally free of carbon monoxide (CO). Beginning
at time t = 0, cigarette smoke containing 4% CO is introduced into the room at a rate of 0.8 cubic feet per
minute. The well-circulated smoke and air mixture is allowed to leave the room at the same rate.
Let A(t) represent the amount of CO in the room (in cubic feet) after t minutes.
(A) Write the DE model for the time rate of change of CO in the room. Also state the initial condition.
dA
dt
A(0)
(B) Solve the IVP to find the amount of CO in the room at any time t > 0.
A(t)
(C) Extended exposure to a CO concentration as low as 0.00012 is harmful to the human body. Find the time
at which this concentration is reached.
t=
minutes
Newton's Law of Cooling tells us that the rate of change of the temperature of an object is proportional to
the temperature difference between the object and its surroundings. This can be modeled by the
differential equation
dT
dt
k(TA), where T is the temperature of the object after t units of time
have passed, A is the ambient temperature of the object's surroundings, and k is a constant of
proportionality.
Suppose that a cup of coffee begins at 178 degrees and, after sitting in room temperature of 61 degrees
for 12 minutes, the coffee reaches 171 degrees. How long will it take before the coffee reaches 155
degrees?
Include at least 2 decimal places in your answer.
minutes
Chapter 12 Solutions
EBK MATHEMATICS FOR THE TRADES
Ch. 12.1 - Solve: 0.82=x100Ch. 12.1 - Prob. 2LCCh. 12.1 - Automotive Trades The following bar graph shows...Ch. 12.1 - Trades Management The following graph shows the...Ch. 12.1 - General Interest The following double bar graph...Ch. 12.1 - General Interest The following stacked bar graph...Ch. 12.1 - Allied Health When Dr. Friedrich began working at...Ch. 12.1 - Automotive Trades The following line graph shows...Ch. 12.1 - Construction The following double-line graph...Ch. 12.1 - General Interest Study the circle graph at the top...
Ch. 12.1 - Prob. 9AECh. 12.1 - Allied Health An assistant at a pharmaceutical...Ch. 12.1 - Fire Protection Plot the following data as a bar...Ch. 12.1 - Transportation The following table lists the total...Ch. 12.1 - Metalworking Draw a bar graph from the following...Ch. 12.1 - Trades Management Plot the following data as a bar...Ch. 12.1 - Construction Plot the following data as a double...Ch. 12.1 - General Interest The following table shows the...Ch. 12.1 - Automotive Trades The following table shows the...Ch. 12.1 - Trades Management The following table shows the...Ch. 12.1 - General Interest The following table shows, by...Ch. 12.1 - Agriculture The following table shows the price...Ch. 12.1 - Allied Health The following table shows the...Ch. 12.1 - General Interest The following data show the U.S....Ch. 12.1 - Fire Protection The following data show the number...Ch. 12.1 - General Interest The following table shows the...Ch. 12.1 - Hydrology The following table shows the daily...Ch. 12.1 - Business and Finance Plot a double broken-line...Ch. 12.1 - Electrical Engineering Plot the following data as...Ch. 12.1 - Water/Wastewater Treatment The following table...Ch. 12.1 - Aviation An aircraft mechanic spends 12.5% of a...Ch. 12.1 - General Interest Recent surveys have shown that...Ch. 12.2 - Find the average of these numbers: 6, 8, 12, 14Ch. 12.2 - What number is halfway between 12 and 15?Ch. 12.2 - Find the mean, median, and mode for each set of...Ch. 12.2 - A. Find the mean, median, and mode for each set of...Ch. 12.2 - A. Find the mean, median, and mode for each set of...Ch. 12.2 - A. Find the mean, median, and mode for each set of...Ch. 12.2 - A. Find the mean, median, and mode for each set of...Ch. 12.2 - A. Find the mean, median, and mode for each set of...Ch. 12.2 - A. Find the mean, median, and mode for each set of...Ch. 12.2 - A. Find the mean, median, and mode for each set of...Ch. 12.2 - Construct an extended frequency distribution for...Ch. 12.2 - Construct an extended frequency distribution for...Ch. 12.2 - Aviation BF Goodrich produces brake pads for...Ch. 12.2 - General Trades The U.S. Department of Labor...Ch. 12.2 - Forestry The following table shows both the total...Ch. 12.2 - Water/Wastewater Treatment The seven-day mean of...Ch. 12.2 - Automotive Trades A mechanic has logged the...Ch. 12.2 - Forestry A forest ranger wishes to determine the...Ch. 12.2 - Hydrology The following table shows the monthly...Ch. 12.2 - Meteorology The National Weather Service provides...Ch. 12.2 - Automotive Trades The following table shows both...Ch. 12.2 - Hydrology The following table shows the daily...Ch. 12.2 - Allied Health The Apgar score is widely used to...Ch. 12.2 - Allied Health A pharmacist keeps careful track of...Ch. 12.2 - Prob. 13CECh. 12.2 - Prob. 14CECh. 12.3 - Calculate: 65 72.5Ch. 12.3 - Calculate: (2.5)2Ch. 12.3 - Prob. 1AECh. 12.3 - Prob. 2AECh. 12.3 - Prob. 3AECh. 12.3 - Calculate the range and the standard deviation for...Ch. 12.3 - Prob. 5AECh. 12.3 - Calculate the range and the standard deviation for...Ch. 12.3 - Prob. 7AECh. 12.3 - Prob. 8AECh. 12.3 - Prob. 1BECh. 12.3 - Prob. 2BECh. 12.3 - Prob. 3BECh. 12.3 - Calculate the standard deviation of the grouped...Ch. 12.3 - Prob. 1CECh. 12.3 - For each set of data, (a) calculate the standard...Ch. 12.3 - Prob. 1DECh. 12.3 - For each set of data, (a) calculate the standard...Ch. 12.3 - Prob. 1EECh. 12.3 - Prob. 2EECh. 12.3 - Prob. 3EECh. 12.3 - Prob. 4EECh. 12.3 - Prob. 5EECh. 12.3 - Prob. 6EECh. 12.3 - Prob. 7EECh. 12.3 - Prob. 8EECh. 12.3 - Prob. 9EECh. 12.3 - Prob. 10EECh. 12.3 - Prob. 11EECh. 12.3 - Prob. 12EECh. 12.3 - Prob. 13EECh. 12.3 - Automotive Trades In testing the acceleration from...Ch. 12 - Read bar graphs, line graphs, and circle graphs....Ch. 12 - Prob. 2PCh. 12 - Prob. 3PCh. 12 - Prob. 4PCh. 12 - Prob. 5PCh. 12 - Prob. 6PCh. 12 - Graph I Electrical Trades In general, as amps...Ch. 12 - Graph I Electrical Trades What is the minimum size...Ch. 12 - Graph I Electrical Trades What is the minimum wire...Ch. 12 - Prob. 4APSCh. 12 - Prob. 5APSCh. 12 - How many grams of fat are contained in a Peanut...Ch. 12 - How many grams of sugar are contained in a...Ch. 12 - How many grams of fat would you consume if you ate...Ch. 12 - How many grams of sugar would you consume if you...Ch. 12 - How many more grams of fat are in two Caramel...Ch. 12 - How many more grams of sugar are in three Peanut...Ch. 12 - Which cookie appears to be the healthiest (as...Ch. 12 - Which cookie appears to be the least healthy (as...Ch. 12 - By what percent does the amount of fat in a...Ch. 12 - By what percent does the amount of sugar in a...Ch. 12 - Retail Merchandising A small computer store is...Ch. 12 - Retail Merchandising A small computer store is...Ch. 12 - Retail Merchandising A small computer store is...Ch. 12 - Retail Merchandising A small computer store is...Ch. 12 - In September, what was the ratio of computer...Ch. 12 - Retail Merchandising A small computer store is...Ch. 12 - Retail Merchandising A small computer store is...Ch. 12 - Retail Merchandising A small computer store is...Ch. 12 - Graph IV Automotive Trades What was the cost per...Ch. 12 - Graph IV Automotive Trades When was the next time...Ch. 12 - Graph IV Automotive Trades During which time...Ch. 12 - Graph IV Automotive Trades During which time...Ch. 12 - Graph IV Automotive Trades What was the difference...Ch. 12 - Graph IV Automotive Trades By what percent did the...Ch. 12 - Graph IV Automotive Trades How much more did it...Ch. 12 - Graph V Business and Finance What was the actual...Ch. 12 - Graph V Business and Finance What was the...Ch. 12 - Graph V Business and Finance During which month...Ch. 12 - Graph V Business and Finance During which month...Ch. 12 - Graph V Business and Finance During which month...Ch. 12 - Graph V Business and Finance During which month...Ch. 12 - Graph V Business and Finance During which months...Ch. 12 - Graph V Business and Finance During which month...Ch. 12 - Graph VI Metalworking What percent of marine...Ch. 12 - Graph VI Metalworking What percent of this alloy...Ch. 12 - Graph VI Metalworking Without measuring, calculate...Ch. 12 - Graph VI Metalworking How many ounces of zinc are...Ch. 12 - Graph VI Metalworking How many grams of bismuth...Ch. 12 - Prob. 1BPSCh. 12 - General Interest The following table shows the...Ch. 12 - Prob. 3BPSCh. 12 - Prob. 4BPSCh. 12 - Prob. 5BPSCh. 12 - Prob. 6BPSCh. 12 - Metalworking Construct a circle graph based on the...Ch. 12 - Fire Protection Construct a circle graph based on...Ch. 12 - General Interest Students in a community college...Ch. 12 - C. Find the mean, median, and mode for each set of...Ch. 12 - C. Find the mean, median, and mode for each set of...Ch. 12 - C. Find the mean, median, and mode for each set of...Ch. 12 - C. Find the mean, median, and mode for each set of...Ch. 12 - Prob. 5CPSCh. 12 - C. Find the mean, median, and mode for each set of...Ch. 12 - D. Calculate (a) the range and (b) the standard...Ch. 12 - D. Calculate (a) the range and (b) the standard...Ch. 12 - Prob. 3DPSCh. 12 - Prob. 4DPSCh. 12 - E. Calculate the mean and the standard deviation...Ch. 12 - Prob. 2EPSCh. 12 - Prob. 1FPSCh. 12 - Meteorology The following table shows the average...Ch. 12 - Agriculture The following data from the United...Ch. 12 - Industrial Technology The Energy Information...Ch. 12 - Police Science To determine the speed that a...Ch. 12 - Agriculture The following list of numbers...Ch. 12 - Sheet Metal Trades The following data represent...Ch. 12 - Prob. 8FPSCh. 12 - Prob. 9FPS
Knowledge Booster


Learn more about
Need a deep-dive on the concept behind this application? Look no further. Learn more about this topic, subject and related others by exploring similar questions and additional content below.Similar questions
- Decide whether each limit exists. If a limit exists, estimate its value. 11. (a) lim f(x) x-3 f(x) ↑ 4 3- 2+ (b) lim f(x) x―0 -2 0 X 1234arrow_forwardcan you help me solve this question and show workings pleasearrow_forwardhow could the bar graph have been organized differently to make it easier to compare opinion changes within political partiesarrow_forward
- ketch a graph of the function f(x) = 3 cos (표) 6. x +1 5 4 3 3 80 9 2+ 1 -9 -8 -7 -6 -5 -4 -3 -2 -1 1 2 3 4 5 6 7 -1 -2 -3+ -4 5 -6+ Clear All Draw: пи > Next Questionarrow_forwardDraw the following graph on the interval πT 5π < x < 2 2 y = 2 sin (2(x+7)) 6. 5. 4 3 3 2 1 +3 /2 -π/3 -π/6 π/6 π/3 π/2 2π/3 5π/6 π 7π/6 4π/3 3π/2 5π/311π/6 2π 13π/67π/3 5π Clear All Draw:arrow_forwardLet f : X → Y and g : Y → Z be two functions. Prove that(1) if g ◦ f is injective, then f is injective; (2) if g ◦ f is surjective, then g is surjective.arrow_forward
- ketch a graph of the function f(x) = 3 cos (표) 6. x +1 5 4 3 3 80 9 2+ 1 -9 -8 -7 -6 -5 -4 -3 -2 -1 1 2 3 4 5 6 7 -1 -2 -3+ -4 5 -6+ Clear All Draw: пи > Next Questionarrow_forwardSolve the following boundary value problem using method of separation of variables ди 11.07 (137) 1 J²u + = = 0, -Пarrow_forward3 2 20-10-18-17-16-15-14-13-12-11-10-9 -8 -7 -6 -$4-3-2-1 -1 -2 -3 4- -5+ The curve above is the graph of a sinusoidal function. It goes through the points (-8, -4) and (6,-4). Find a sinusoidal function that matches the given graph. If needed, you can enter π=3.1416... as 'pi' in your answer, otherwise use at least 3 decimal digits. f(x) = > Next Question Barrow_forwardX Grades for X Assignmen X A-Z Datab XE Biocultural X EBSCO-Ful X Review es/119676/assignments/3681238 Review Quiz 8.1-p2 points possible Answered: 3/5 ● Question 1 4+ 3. 2 1 13 /12-11 -10 -9 -8 -7 -6 -5 -4 -3 -2 -1 1 2 3 4 -1 -2 -3 -4- 5 2 6 The curve above is the graph of a sinusoidal function. It goes through the points (-7,0) and (3,0). Find a sinusoidal function that matches the given graph. If needed, you can enter π=3.1416... as 'pi' in your answer, otherwise use at least 3 decimal digits. f(x) = > Next Question 申 J % F 刀 Q Search S € t ח Y 7 I * 00 J ப I Darrow_forward2 d) Draw the following graph on the interval k 5π Next Questionarrow_forwardDraw the following graph on the interval 5л Next Questionarrow_forwardarrow_back_iosSEE MORE QUESTIONSarrow_forward_ios
Recommended textbooks for you
 Glencoe Algebra 1, Student Edition, 9780079039897...AlgebraISBN:9780079039897Author:CarterPublisher:McGraw Hill
 Elementary AlgebraAlgebraISBN:9780998625713Author:Lynn Marecek, MaryAnne Anthony-SmithPublisher:OpenStax - Rice University
Glencoe Algebra 1, Student Edition, 9780079039897...
Algebra
ISBN:9780079039897
Author:Carter
Publisher:McGraw Hill
Elementary Algebra
Algebra
ISBN:9780998625713
Author:Lynn Marecek, MaryAnne Anthony-Smith
Publisher:OpenStax - Rice University
Correlation Vs Regression: Difference Between them with definition & Comparison Chart; Author: Key Differences;https://www.youtube.com/watch?v=Ou2QGSJVd0U;License: Standard YouTube License, CC-BY
Correlation and Regression: Concepts with Illustrative examples; Author: LEARN & APPLY : Lean and Six Sigma;https://www.youtube.com/watch?v=xTpHD5WLuoA;License: Standard YouTube License, CC-BY