
EBK MATHEMATICS FOR THE TRADES
11th Edition
ISBN: 8220106960455
Author: CARMAN
Publisher: PEARSON
expand_more
expand_more
format_list_bulleted
Concept explainers
Videos
Textbook Question
Chapter 12.1, Problem 15BE
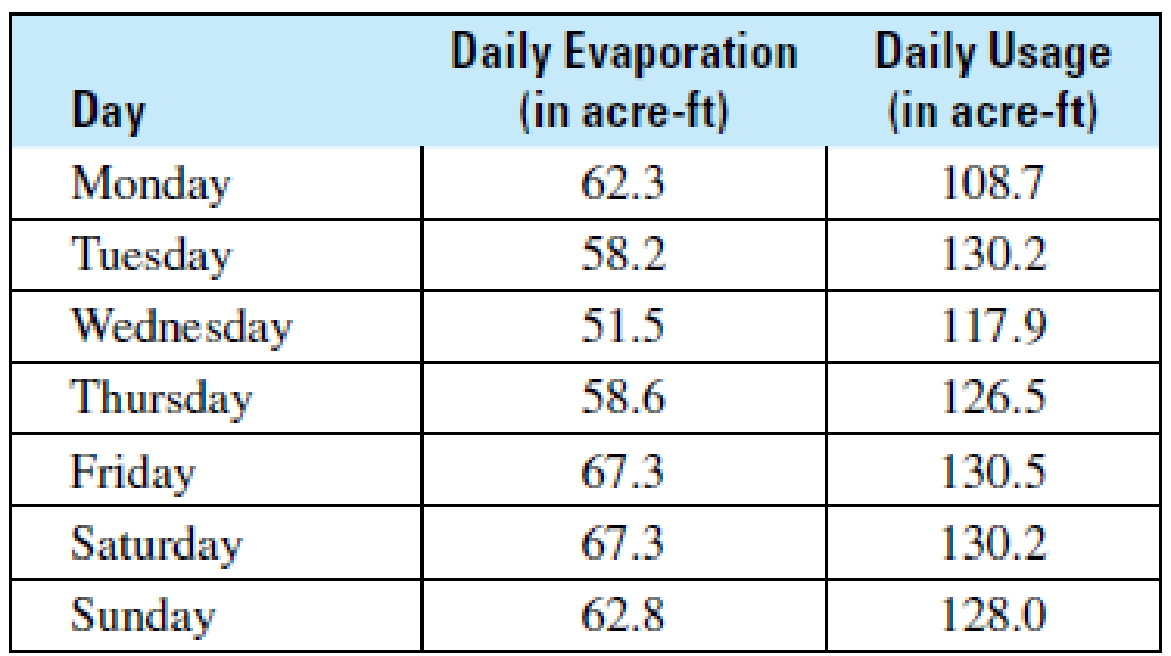
Hydrology The following table shows the daily evaporation and usage totals, in acre-feet, during a summer week at Bradbury Dam. Use these data to construct a double broken-line graph.
Expert Solution & Answer
Want to see the full answer?
Check out a sample textbook solution
Students have asked these similar questions
The expression (w.wx+8) represents the number of miles Trent jogged during a race, and 5x represents the number of miles that Ling jogged during the same race, in x hours. Write and simplified expression to show how many more miles Ling jogged than Trent
Firm Alpha operates in a perfectly competitive market in a constant-cost industry and is earning negative economic profit.
a. How does Firm Alpha determine its profit-maximizing quantity of output? Explain.
b. Draw correctly labeled side-by-side graphs for Firm Alpha and the market it operates in. Label the axes and all of the following:
i. Market price (PE) and market quantity (QE)
ii. The firm's quantity of output (Qe)
iii. The firm's average total cost (ATC)
c. Completely shade the area of the firm's total cost.
d. Identify whether the following increase, decrease, or remain constant as the market moves to long-run equilibrium:
i. Market equilibrium quantity
ii. Market equilibrium price
e. Assume the product that Firm Alpha produces has a negative externality. Draw the marginal social cost (MSC) on the market graph from part (b).
f. Will the unregulated market produce more or less than the socially optimal quantity?
g. Label the socially optimal quantity (Qso) for the market on your…
Goods A, B, and C are related goods, each operating in a perfectly competitive market.
a. As the price of Good A increases from $8 to $10, its quantity demanded falls from 200 units to 160 units. Calculate the price elasticity of demand for this range.
b. Good A is an input for Good B. Illustrate the effect of the price change from part (a) on a fully labeled supply and demand graph for Good B. Label the equilibrium price(s) and quantity or quantities. Use arrows to indicate any shifts.
c. On your graph from (b), shade the consumer surplus lost in the market for Good B as a result of the change in part (a).
d. The equilibrium price for Good C is $2, and the equilibrium quantity is 60 units. The cross-price elasticity of Good C with Good A is -3.
i. Are Good C and Good A normal goods, inferior goods, complementary goods, or substitute goods?
ii. Calculate the new equilibrium quantity of Good C after a 25% price increase for Good A.
Chapter 12 Solutions
EBK MATHEMATICS FOR THE TRADES
Ch. 12.1 - Solve: 0.82=x100Ch. 12.1 - Prob. 2LCCh. 12.1 - Automotive Trades The following bar graph shows...Ch. 12.1 - Trades Management The following graph shows the...Ch. 12.1 - General Interest The following double bar graph...Ch. 12.1 - General Interest The following stacked bar graph...Ch. 12.1 - Allied Health When Dr. Friedrich began working at...Ch. 12.1 - Automotive Trades The following line graph shows...Ch. 12.1 - Construction The following double-line graph...Ch. 12.1 - General Interest Study the circle graph at the top...
Ch. 12.1 - Prob. 9AECh. 12.1 - Allied Health An assistant at a pharmaceutical...Ch. 12.1 - Fire Protection Plot the following data as a bar...Ch. 12.1 - Transportation The following table lists the total...Ch. 12.1 - Metalworking Draw a bar graph from the following...Ch. 12.1 - Trades Management Plot the following data as a bar...Ch. 12.1 - Construction Plot the following data as a double...Ch. 12.1 - General Interest The following table shows the...Ch. 12.1 - Automotive Trades The following table shows the...Ch. 12.1 - Trades Management The following table shows the...Ch. 12.1 - General Interest The following table shows, by...Ch. 12.1 - Agriculture The following table shows the price...Ch. 12.1 - Allied Health The following table shows the...Ch. 12.1 - General Interest The following data show the U.S....Ch. 12.1 - Fire Protection The following data show the number...Ch. 12.1 - General Interest The following table shows the...Ch. 12.1 - Hydrology The following table shows the daily...Ch. 12.1 - Business and Finance Plot a double broken-line...Ch. 12.1 - Electrical Engineering Plot the following data as...Ch. 12.1 - Water/Wastewater Treatment The following table...Ch. 12.1 - Aviation An aircraft mechanic spends 12.5% of a...Ch. 12.1 - General Interest Recent surveys have shown that...Ch. 12.2 - Find the average of these numbers: 6, 8, 12, 14Ch. 12.2 - What number is halfway between 12 and 15?Ch. 12.2 - Find the mean, median, and mode for each set of...Ch. 12.2 - A. Find the mean, median, and mode for each set of...Ch. 12.2 - A. Find the mean, median, and mode for each set of...Ch. 12.2 - A. Find the mean, median, and mode for each set of...Ch. 12.2 - A. Find the mean, median, and mode for each set of...Ch. 12.2 - A. Find the mean, median, and mode for each set of...Ch. 12.2 - A. Find the mean, median, and mode for each set of...Ch. 12.2 - A. Find the mean, median, and mode for each set of...Ch. 12.2 - Construct an extended frequency distribution for...Ch. 12.2 - Construct an extended frequency distribution for...Ch. 12.2 - Aviation BF Goodrich produces brake pads for...Ch. 12.2 - General Trades The U.S. Department of Labor...Ch. 12.2 - Forestry The following table shows both the total...Ch. 12.2 - Water/Wastewater Treatment The seven-day mean of...Ch. 12.2 - Automotive Trades A mechanic has logged the...Ch. 12.2 - Forestry A forest ranger wishes to determine the...Ch. 12.2 - Hydrology The following table shows the monthly...Ch. 12.2 - Meteorology The National Weather Service provides...Ch. 12.2 - Automotive Trades The following table shows both...Ch. 12.2 - Hydrology The following table shows the daily...Ch. 12.2 - Allied Health The Apgar score is widely used to...Ch. 12.2 - Allied Health A pharmacist keeps careful track of...Ch. 12.2 - Prob. 13CECh. 12.2 - Prob. 14CECh. 12.3 - Calculate: 65 72.5Ch. 12.3 - Calculate: (2.5)2Ch. 12.3 - Prob. 1AECh. 12.3 - Prob. 2AECh. 12.3 - Prob. 3AECh. 12.3 - Calculate the range and the standard deviation for...Ch. 12.3 - Prob. 5AECh. 12.3 - Calculate the range and the standard deviation for...Ch. 12.3 - Prob. 7AECh. 12.3 - Prob. 8AECh. 12.3 - Prob. 1BECh. 12.3 - Prob. 2BECh. 12.3 - Prob. 3BECh. 12.3 - Calculate the standard deviation of the grouped...Ch. 12.3 - Prob. 1CECh. 12.3 - For each set of data, (a) calculate the standard...Ch. 12.3 - Prob. 1DECh. 12.3 - For each set of data, (a) calculate the standard...Ch. 12.3 - Prob. 1EECh. 12.3 - Prob. 2EECh. 12.3 - Prob. 3EECh. 12.3 - Prob. 4EECh. 12.3 - Prob. 5EECh. 12.3 - Prob. 6EECh. 12.3 - Prob. 7EECh. 12.3 - Prob. 8EECh. 12.3 - Prob. 9EECh. 12.3 - Prob. 10EECh. 12.3 - Prob. 11EECh. 12.3 - Prob. 12EECh. 12.3 - Prob. 13EECh. 12.3 - Automotive Trades In testing the acceleration from...Ch. 12 - Read bar graphs, line graphs, and circle graphs....Ch. 12 - Prob. 2PCh. 12 - Prob. 3PCh. 12 - Prob. 4PCh. 12 - Prob. 5PCh. 12 - Prob. 6PCh. 12 - Graph I Electrical Trades In general, as amps...Ch. 12 - Graph I Electrical Trades What is the minimum size...Ch. 12 - Graph I Electrical Trades What is the minimum wire...Ch. 12 - Prob. 4APSCh. 12 - Prob. 5APSCh. 12 - How many grams of fat are contained in a Peanut...Ch. 12 - How many grams of sugar are contained in a...Ch. 12 - How many grams of fat would you consume if you ate...Ch. 12 - How many grams of sugar would you consume if you...Ch. 12 - How many more grams of fat are in two Caramel...Ch. 12 - How many more grams of sugar are in three Peanut...Ch. 12 - Which cookie appears to be the healthiest (as...Ch. 12 - Which cookie appears to be the least healthy (as...Ch. 12 - By what percent does the amount of fat in a...Ch. 12 - By what percent does the amount of sugar in a...Ch. 12 - Retail Merchandising A small computer store is...Ch. 12 - Retail Merchandising A small computer store is...Ch. 12 - Retail Merchandising A small computer store is...Ch. 12 - Retail Merchandising A small computer store is...Ch. 12 - In September, what was the ratio of computer...Ch. 12 - Retail Merchandising A small computer store is...Ch. 12 - Retail Merchandising A small computer store is...Ch. 12 - Retail Merchandising A small computer store is...Ch. 12 - Graph IV Automotive Trades What was the cost per...Ch. 12 - Graph IV Automotive Trades When was the next time...Ch. 12 - Graph IV Automotive Trades During which time...Ch. 12 - Graph IV Automotive Trades During which time...Ch. 12 - Graph IV Automotive Trades What was the difference...Ch. 12 - Graph IV Automotive Trades By what percent did the...Ch. 12 - Graph IV Automotive Trades How much more did it...Ch. 12 - Graph V Business and Finance What was the actual...Ch. 12 - Graph V Business and Finance What was the...Ch. 12 - Graph V Business and Finance During which month...Ch. 12 - Graph V Business and Finance During which month...Ch. 12 - Graph V Business and Finance During which month...Ch. 12 - Graph V Business and Finance During which month...Ch. 12 - Graph V Business and Finance During which months...Ch. 12 - Graph V Business and Finance During which month...Ch. 12 - Graph VI Metalworking What percent of marine...Ch. 12 - Graph VI Metalworking What percent of this alloy...Ch. 12 - Graph VI Metalworking Without measuring, calculate...Ch. 12 - Graph VI Metalworking How many ounces of zinc are...Ch. 12 - Graph VI Metalworking How many grams of bismuth...Ch. 12 - Prob. 1BPSCh. 12 - General Interest The following table shows the...Ch. 12 - Prob. 3BPSCh. 12 - Prob. 4BPSCh. 12 - Prob. 5BPSCh. 12 - Prob. 6BPSCh. 12 - Metalworking Construct a circle graph based on the...Ch. 12 - Fire Protection Construct a circle graph based on...Ch. 12 - General Interest Students in a community college...Ch. 12 - C. Find the mean, median, and mode for each set of...Ch. 12 - C. Find the mean, median, and mode for each set of...Ch. 12 - C. Find the mean, median, and mode for each set of...Ch. 12 - C. Find the mean, median, and mode for each set of...Ch. 12 - Prob. 5CPSCh. 12 - C. Find the mean, median, and mode for each set of...Ch. 12 - D. Calculate (a) the range and (b) the standard...Ch. 12 - D. Calculate (a) the range and (b) the standard...Ch. 12 - Prob. 3DPSCh. 12 - Prob. 4DPSCh. 12 - E. Calculate the mean and the standard deviation...Ch. 12 - Prob. 2EPSCh. 12 - Prob. 1FPSCh. 12 - Meteorology The following table shows the average...Ch. 12 - Agriculture The following data from the United...Ch. 12 - Industrial Technology The Energy Information...Ch. 12 - Police Science To determine the speed that a...Ch. 12 - Agriculture The following list of numbers...Ch. 12 - Sheet Metal Trades The following data represent...Ch. 12 - Prob. 8FPSCh. 12 - Prob. 9FPS
Knowledge Booster


Learn more about
Need a deep-dive on the concept behind this application? Look no further. Learn more about this topic, subject and related others by exploring similar questions and additional content below.Similar questions
- Let a = (-4, 5, 4) and 6 = (1,0, -1). Find the angle between the vector 1) The exact angle is cos 2) The approximation in radians isarrow_forwardThe only problems I need help with ae the last 8 ones, Thanksarrow_forwardPrice (S) The graph below depicts a firm with market power. In the graph, MC represents the firm's marginal costs, ATC represents the average total costs, D represents demand, and MR represents marginal revenue. 110 70 60 50 40 30 20 MC ATC D 0 40 50 70 80 95 Quantity/Units MR a. At 60 units of output, how much would this profit-maximizing monopolist charge? b. How many units would it produce to maximize total revenue rather than total profit? c. What is the maximum quantity this firm can produce without incurring economic losses? d. Calculate the firm's profit at the profit-maximizing output and price. e. Why is this firm's marginal revenue curve below its demand curve? Explain.arrow_forward
- A well-known company predominantly makes flat pack furniture for students. Variability with the automated machinery means the wood components are cut with a standard deviation in length of 0.45 mm. After they are cut the components are measured. If their length is more than 1.2 mm from the required length, the components are rejected. a) Calculate the percentage of components that get rejected. b) In a manufacturing run of 1000 units, how many are expected to be rejected? c) The company wishes to install more accurate equipment in order to reduce the rejection rate by one-half, using the same ±1.2mm rejection criterion. Calculate the maximum acceptable standard deviation of the new process.arrow_forwardFind the (exact) direction cosines and (rounded to 1 decimal place) direction angles of = (3,7,6)arrow_forwardShade the areas givenarrow_forward
- 5. Let X and Y be independent random variables and let the superscripts denote symmetrization (recall Sect. 3.6). Show that (X + Y) X+ys.arrow_forwardLet a = (-1, -2, -3) and 6 = (-4, 0, 1). Find the component of b onto a.arrow_forwardForces of 9 pounds and 15 pounds act on each other with an angle of 72°. The magnitude of the resultant force The resultant force has an angle of pounds. * with the 9 pound force. The resultant force has an angle of with the 15 pound force. It is best to calculate each angle separately and check by seeing if they add to 72°.arrow_forward
- 1. Sketch the following sets and determine which are domains: (a) |z−2+i| ≤ 1; - (c) Imz> 1; (e) 0≤ arg z≤ л/4 (z ± 0); Ans. (b), (c) are domains. (b) |2z+3| > 4; (d) Im z = 1; - (f) | z − 4| ≥ |z.arrow_forward8. Suppose that the moments of the random variable X are constant, that is, suppose that EX" =c for all n ≥ 1, for some constant c. Find the distribution of X.arrow_forward9. The concentration function of a random variable X is defined as Qx(h) = sup P(x ≤ X ≤x+h), h>0. Show that, if X and Y are independent random variables, then Qx+y (h) min{Qx(h). Qr (h)).arrow_forward
arrow_back_ios
SEE MORE QUESTIONS
arrow_forward_ios
Recommended textbooks for you
 Glencoe Algebra 1, Student Edition, 9780079039897...AlgebraISBN:9780079039897Author:CarterPublisher:McGraw Hill
 Algebra & Trigonometry with Analytic GeometryAlgebraISBN:9781133382119Author:SwokowskiPublisher:Cengage
 College Algebra (MindTap Course List)AlgebraISBN:9781305652231Author:R. David Gustafson, Jeff HughesPublisher:Cengage Learning
 Holt Mcdougal Larson Pre-algebra: Student Edition...AlgebraISBN:9780547587776Author:HOLT MCDOUGALPublisher:HOLT MCDOUGAL
 Big Ideas Math A Bridge To Success Algebra 1: Stu...AlgebraISBN:9781680331141Author:HOUGHTON MIFFLIN HARCOURTPublisher:Houghton Mifflin Harcourt
 Trigonometry (MindTap Course List)TrigonometryISBN:9781305652224Author:Charles P. McKeague, Mark D. TurnerPublisher:Cengage Learning
Glencoe Algebra 1, Student Edition, 9780079039897...
Algebra
ISBN:9780079039897
Author:Carter
Publisher:McGraw Hill
Algebra & Trigonometry with Analytic Geometry
Algebra
ISBN:9781133382119
Author:Swokowski
Publisher:Cengage
College Algebra (MindTap Course List)
Algebra
ISBN:9781305652231
Author:R. David Gustafson, Jeff Hughes
Publisher:Cengage Learning
Holt Mcdougal Larson Pre-algebra: Student Edition...
Algebra
ISBN:9780547587776
Author:HOLT MCDOUGAL
Publisher:HOLT MCDOUGAL
Big Ideas Math A Bridge To Success Algebra 1: Stu...
Algebra
ISBN:9781680331141
Author:HOUGHTON MIFFLIN HARCOURT
Publisher:Houghton Mifflin Harcourt
Trigonometry (MindTap Course List)
Trigonometry
ISBN:9781305652224
Author:Charles P. McKeague, Mark D. Turner
Publisher:Cengage Learning
The Shape of Data: Distributions: Crash Course Statistics #7; Author: CrashCourse;https://www.youtube.com/watch?v=bPFNxD3Yg6U;License: Standard YouTube License, CC-BY
Shape, Center, and Spread - Module 20.2 (Part 1); Author: Mrmathblog;https://www.youtube.com/watch?v=COaid7O_Gag;License: Standard YouTube License, CC-BY
Shape, Center and Spread; Author: Emily Murdock;https://www.youtube.com/watch?v=_YyW0DSCzpM;License: Standard Youtube License