Mathematical Ideas (13th Edition) - Standalone book
13th Edition
ISBN: 9780321977076
Author: Charles D. Miller, Vern E. Heeren, John Hornsby, Christopher Heeren
Publisher: PEARSON
expand_more
expand_more
format_list_bulleted
Concept explainers
Videos
Textbook Question
Chapter 12.1, Problem 11E
Federal Revenue and Spending The graph shows U.S. government receipts and outlays (both on-budget and off-budget) for 2001-2012. Refer to the graph for Exercises 11-15.
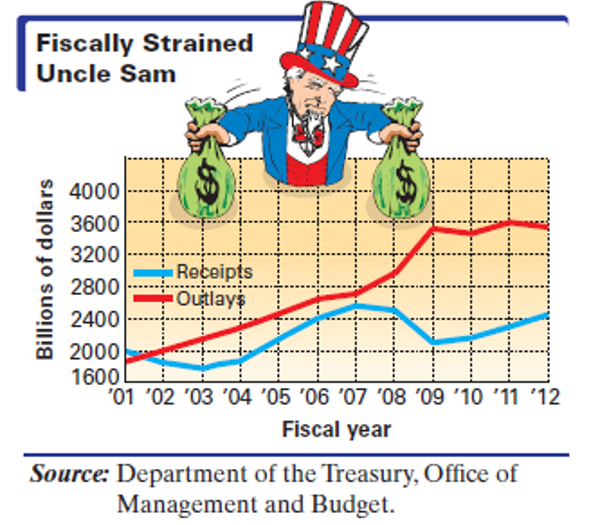
For the period 2001-2012, list all years when receipts exceeded outlays.
Expert Solution & Answer
Want to see the full answer?
Check out a sample textbook solution
Students have asked these similar questions
Melissa claims the triangles are similar. Is her claim correct? If her claim is correct, state the transformations that map
△MNO
△MNO
onto
△PRQ.
△PRQ.
If her claim is not correct, explain why.
2 (VaR and ES) Suppose X1
are independent. Prove that
~
Unif[-0.5, 0.5] and X2
VaRa (X1X2) < VaRa(X1) + VaRa (X2).
~
Unif[-0.5, 0.5]
8 (Correlation and Diversification)
Assume we have two stocks, A and B, show that a particular combination
of the two stocks produce a risk-free portfolio when the correlation between
the return of A and B is -1.
Chapter 12 Solutions
Mathematical Ideas (13th Edition) - Standalone book
Ch. 12.1 - In Exercises I and 2, use the given data to do the...Ch. 12.1 - In Exercises 1 and 2, use the given data to do the...Ch. 12.1 - In Exercises 3-6, use the given data to do the...Ch. 12.1 - In Exercises 3-6, use the given data to do the...Ch. 12.1 - In Exercises 3-6, use the given data to do the...Ch. 12.1 - In Exercises 3-6, use the given data to do the...Ch. 12.1 - In each of Exercises 7-10, construct a...Ch. 12.1 - In each of Exercises 7-10, construct a...Ch. 12.1 - In each of Exercises 7-10, construct a...Ch. 12.1 - In each of Exercises 7-10, construct a...
Ch. 12.1 - Federal Revenue and Spending The graph shows U.S....Ch. 12.1 - Federal Revenue and Spending The graph shows U.S....Ch. 12.1 - Federal Revenue and Spending The graph shows U.S....Ch. 12.1 - Federal Revenue and Spending The graph shows U.S....Ch. 12.1 - Prob. 15ECh. 12.1 - Refer to the above graphs for Exercises 16-20....Ch. 12.1 - Prob. 17ECh. 12.1 - Refer to the above graphs for Exercises 16-20....Ch. 12.1 - Prob. 19ECh. 12.1 - Refer to the above graphs for Exercises 16-20....Ch. 12.1 - Reading a Circle Graph of Job-Training Sources The...Ch. 12.1 - Reading a Circle Graph of Job-Training Sources The...Ch. 12.1 - Prob. 23ECh. 12.1 - Correspondence between Education and Earnings Data...Ch. 12.1 - Prob. 25ECh. 12.1 - Net Worth of Retirement Savings Saura, wishing to...Ch. 12.1 - Prob. 27ECh. 12.1 - Net Worth of Retirement Savings Saura, wishing to...Ch. 12.1 - Prob. 29ECh. 12.1 - Sample Masses in a Geology Laboratory...Ch. 12.1 - Sample Masses in a Geology Laboratory...Ch. 12.1 - Record Temperatures According to the National...Ch. 12.1 - Prob. 33ECh. 12.1 - Frequencies and Probabilities of letter Occurrence...Ch. 12.1 - Prob. 35ECh. 12.1 - Prob. 36ECh. 12.1 - 37. Is the probability distribution in Exercise 36...Ch. 12.1 - Prob. 38ECh. 12.1 - Probabilities of Study Times Recall that the...Ch. 12.1 - Favorite Sports among Recreation Students The 40...Ch. 12.1 - Favorite Sports among Recreation Students The 40...Ch. 12.1 - Favorite Sports among Recreation Students The 40...Ch. 12.2 - For each list of data, calculate (a) the mean (to...Ch. 12.2 - For each list of data, calculate (a) the mean (to...Ch. 12.2 - For each list of data, calculate (a), the mean (to...Ch. 12.2 - For each list of data, calculate (a) the mean (to...Ch. 12.2 - For each list of data, calculate (a) the mean (to...Ch. 12.2 - For each list of data, calculate (a) the mean (to...Ch. 12.2 - For each list of data, calculate (a) the mean (to...Ch. 12.2 - For each list of data, calculate (a) the mean (to...Ch. 12.2 - Answer each question. Gymnasts' Scores An Olympic...Ch. 12.2 - Quiz Grades The average of 5 quiz grades is 10....Ch. 12.2 - For each category in Exercises 11-16, find (a) (he...Ch. 12.2 - For each category in Exercises 11-16, find (a) the...Ch. 12.2 - For each category in Exercises 11-16, find (a) the...Ch. 12.2 - For each category in Exercises 11-16, find (a) the...Ch. 12.2 - For each category in Exercises 11-16, find (a) the...Ch. 12.2 - For each category in Exercises 11-16, find (a) the...Ch. 12.2 - Leading U.S. Businesses The table shows the top...Ch. 12.2 - Leading U.S. Businesses The table shows the top...Ch. 12.2 - Measuring Elapsed Times While doing an experiment,...Ch. 12.2 - Measuring Elapsed Times White doing an experiment,...Ch. 12.2 - The student from Exercises 19 and 20,when...Ch. 12.2 - The student from Exercises 19 and 20,when...Ch. 12.2 - The student from Exercises 19 and 20,when...Ch. 12.2 - The student from Exercises 19 and 20, when...Ch. 12.2 - Scores on Management Examinations Thao earned the...Ch. 12.2 - Scores on Management Examinations Thao earned the...Ch. 12.2 - Scores on Management Examinations Thao earned the...Ch. 12.2 - For each of the following frequency distributions,...Ch. 12.2 - Prob. 29ECh. 12.2 - 30. Average Employee Salary A company has
15...Ch. 12.2 - Grade-Point Averages Find the grade-point average...Ch. 12.2 - Grade-Point Averages Find the grade-point average...Ch. 12.2 - Prob. 33ECh. 12.2 - Federal Budget Totals The table gives federal...Ch. 12.2 - Prob. 35ECh. 12.2 - World Cell Phone Use In 2012, just the top six...Ch. 12.2 - Prob. 37ECh. 12.2 - Crew, Passengers, and Hijackers on 3/11 Airliners...Ch. 12.2 - Prob. 39ECh. 12.2 - Olympic Medal Standings The top ten medal-winning...Ch. 12.2 - Prob. 41ECh. 12.2 - Olympic Medal Standings The top ten medal-winning...Ch. 12.2 - Prob. 43ECh. 12.2 - In Exercises 44 and 45, use the given...Ch. 12.2 - Prob. 45ECh. 12.2 - What does your box plot of Exercise 18 for...Ch. 12.2 - Prob. 47ECh. 12.2 - Prob. 48ECh. 12.2 - Prob. 49ECh. 12.2 - Prob. 50ECh. 12.2 - Prob. 51ECh. 12.2 - Prob. 52ECh. 12.2 - Prob. 53ECh. 12.2 - Prob. 54ECh. 12.2 - Prob. 55ECh. 12.2 - Prob. 56ECh. 12.2 - Prob. 57ECh. 12.2 - Prob. 58ECh. 12.2 - For Exercises 57-59, refer to the grouped...Ch. 12.2 - Prob. 60ECh. 12.3 - 1. If your calculator finds both the sample...Ch. 12.3 - 2. If your calculator finds only one kind of...Ch. 12.3 - Find (a) the range, and (b) the standard deviation...Ch. 12.3 - Find (a) the range, and (b) the standard deviation...Ch. 12.3 - Find (a) the range, and (b) the standard deviation...Ch. 12.3 - Find (a) the range, and (b) the standard deviation...Ch. 12.3 - Find (a) the range, and (b) the standard deviation...Ch. 12.3 - Find (a) the range, and (b) the standard deviation...Ch. 12.3 - Find (a) the range, and (b) the standard deviation...Ch. 12.3 - Find (a) the range, and (b) the standard deviation...Ch. 12.3 - Use Chebyshev’s theorem for Exercises 11-22. Give...Ch. 12.3 - Use Chebyshev's theorem for Exercises 11-22. Give...Ch. 12.3 - Use Chebyshev's theorem for Exercises 11-22. Give...Ch. 12.3 - Use Chebyshev's theorem for Exercises 11-22. Give...Ch. 12.3 - Prob. 15ECh. 12.3 - Use Chebyshev's theorem for Exercises 11-22. Give...Ch. 12.3 - Prob. 17ECh. 12.3 - Use Chebyshev's theorem for Exercises 11-22. Give...Ch. 12.3 - Use Chebyshev's theorem for Exercises 11-22. Give...Ch. 12.3 - Use Chebyshev's theorem for Exercises 11-22. Give...Ch. 12.3 - Prob. 21ECh. 12.3 - Use Chebyshev's theorem for Exercises 11-22. Give...Ch. 12.3 - Prob. 23ECh. 12.3 - Travel Accommodation CostsGabriel and Lucia took a...Ch. 12.3 - Travel Accommodation Costs Gabriel and Lucia took...Ch. 12.3 - Travel Accommodation Costs Gabriel and Lucia took...Ch. 12.3 - Travel Accommodation Costs Gabriel and Lucia took...Ch. 12.3 - Travel Accommodation Costs Gabriel and Lucia took...Ch. 12.3 - In Exercises 29 and 30, two samples are given. In...Ch. 12.3 - In Exercises 29 and 30, two samples are given. In...Ch. 12.3 - Utilize the following sample for Exercises...Ch. 12.3 - Utilize the following sample for Exercises 31-36....Ch. 12.3 - Prob. 33ECh. 12.3 - Utilize the following sample for Exercises...Ch. 12.3 - Prob. 35ECh. 12.3 - Utilize the following sample for Exercises...Ch. 12.3 - 37. Comparing Water Heater Lifetimes Two brands of...Ch. 12.3 - Lifetimes of Engine Control Modules Chin manages...Ch. 12.3 - Lifetimes of Engine Control Modules Chin manages...Ch. 12.3 - Prob. 40ECh. 12.3 - 41. In Section 12.2 we showed that the mean, as a...Ch. 12.3 - Prob. 42ECh. 12.3 - A Cereal-Marketing Survey A food distribution...Ch. 12.3 - A Cereal-Marketing Survey A food distribution...Ch. 12.3 - A Cereal-Marketing Survey A food distribution...Ch. 12.3 - Prob. 46ECh. 12.3 - Prob. 47ECh. 12.3 - Prob. 48ECh. 12.3 - Prob. 49ECh. 12.3 - Prob. 50ECh. 12.3 - Prob. 51ECh. 12.3 - Prob. 52ECh. 12.4 - Numbers of Restaurant Customers Refer to the...Ch. 12.4 - Numbers of Restaurant Customers Refer to the...Ch. 12.4 - Numbers of Restaurant Customers Refer to the...Ch. 12.4 - Numbers of Restaurant Customers Refer to the...Ch. 12.4 - In Exercises 5-8, make use of z-scores.
5....Ch. 12.4 - In Exercises 5-8, make use of z-scores.
6....Ch. 12.4 - In Exercises 5-8, make use of z-scores.
7....Ch. 12.4 - In Exercises 5-8, make use of z-scores. Relative...Ch. 12.4 - World's Largest Energy Producers and Consumers The...Ch. 12.4 - World's Largest Energy Producers and Consumers The...Ch. 12.4 - World's Largest Energy Producers and Consumers The...Ch. 12.4 - World's Largest Energy Producers and Consumers The...Ch. 12.4 - World's Largest Energy Producers and Consumers The...Ch. 12.4 - World's Largest Energy Producers and ConsumersThe...Ch. 12.4 - World's Largest Energy Producers and Consumers The...Ch. 12.4 - World's Largest Energy Producers and Consumers The...Ch. 12.4 - Determine which was relatively higher: Canada in...Ch. 12.4 - Construct box plots for both production and...Ch. 12.4 - Prob. 19ECh. 12.4 - 20. Comparing your two box plots of Exercise 18,...Ch. 12.4 - The text stated that for any distribution of data,...Ch. 12.4 - 22. Describe the basic difference between a...Ch. 12.4 - Prob. 23ECh. 12.4 - This chapter has introduced three major...Ch. 12.4 - Prob. 25ECh. 12.4 - Prob. 26ECh. 12.4 - Prob. 27ECh. 12.4 - Prob. 28ECh. 12.4 - Prob. 29ECh. 12.4 - Prob. 30ECh. 12.4 - Prob. 31ECh. 12.4 - Prob. 32ECh. 12.4 - In Exercises 32-35, answer yes or no and explain...Ch. 12.4 - In Exercises 32-35, answer yes or no and explain...Ch. 12.4 - In Exercises 32-35, answer yes or no and explain...Ch. 12.4 - Prob. 36ECh. 12.4 - Prob. 37ECh. 12.4 - Prob. 38ECh. 12.4 - Prob. 39ECh. 12.4 - Prob. 40ECh. 12.4 - Prob. 41ECh. 12.4 - Prob. 42ECh. 12.4 - Prob. 43ECh. 12.4 - Prob. 44ECh. 12.4 - Prob. 45ECh. 12.4 - Prob. 46ECh. 12.4 - Prob. 47ECh. 12.4 - Prob. 48ECh. 12.4 - Prob. 49ECh. 12.4 - Prob. 50ECh. 12.4 - Prob. 51ECh. 12.4 - Prob. 52ECh. 12.4 - Prob. 53ECh. 12.4 - Prob. 54ECh. 12.5 - Identify each variable quantity as discrete or...Ch. 12.5 - Identify each variable quantity as discrete or...Ch. 12.5 - Identify each variable quantity as discrete or...Ch. 12.5 - Prob. 4ECh. 12.5 - Identify each variable quantity as discrete or...Ch. 12.5 - Prob. 6ECh. 12.5 - Measuring the Mass of Ore Samples Suppose 100...Ch. 12.5 - Measuring the Mass of Ore Samples Suppose 100...Ch. 12.5 - Measuring the Mass of Ore Samples Suppose 100...Ch. 12.5 - Measuring the Mass of Ore Samples Suppose 100...Ch. 12.5 - Distribution of IQ Scores On standard IQ tests,...Ch. 12.5 - Distribution of IQ Scores On standard IQ tests,...Ch. 12.5 - Distribution of IQ Scores On standard IQ tests,...Ch. 12.5 - Distribution of IQ Scores On standard IQ tests,...Ch. 12.5 - Find the percentage of area under a normal curve...Ch. 12.5 - Find the percentage of area under a normal curve...Ch. 12.5 - Find the percentage of area under a normal curve...Ch. 12.5 - Find the percentage of area under a normal curve...Ch. 12.5 - Find the percentage of the total area under a...Ch. 12.5 - Find the percentage of the total area under a...Ch. 12.5 - Find the percentage of the total area under a...Ch. 12.5 - Find the percentage of the total area under a...Ch. 12.5 - Find a value of z such that each condition is met....Ch. 12.5 - Find a value of z such that each condition is met....Ch. 12.5 - Find a value of z such that each condition
25....Ch. 12.5 - Find a value of z such that each condition is...Ch. 12.5 - Weights of Peaches A fruit-packing company...Ch. 12.5 - Weights of Peaches A fruit-packing company...Ch. 12.5 - Weights of Peaches A fruit-packing company...Ch. 12.5 - Weights of Peaches A fruit-packing company...Ch. 12.5 - Weights of Peaches A fruit-packing company...Ch. 12.5 - Prob. 32ECh. 12.5 - Prob. 33ECh. 12.5 - Prob. 34ECh. 12.5 - IQs of Employees A large company employs workers...Ch. 12.5 - Prob. 36ECh. 12.5 - Net Weight of Cereal Boxes A certain dry cereal is...Ch. 12.5 - Prob. 38ECh. 12.5 - Prob. 39ECh. 12.5 - Net Weight of Cereal Boxes A certain dry cereal is...Ch. 12.5 - Prob. 41ECh. 12.5 - Prob. 42ECh. 12.5 - Prob. 43ECh. 12.5 - Prob. 44ECh. 12.5 - Assume the following distributions are all normal,...Ch. 12.5 - Prob. 46ECh. 12.5 - Prob. 47ECh. 12.5 - Prob. 48ECh. 12.5 - Prob. 49ECh. 12.5 - Prob. 50ECh. 12.5 - Prob. 51ECh. 12.5 - Prob. 52ECh. 12.5 - Prob. 53ECh. 12.5 - Prob. 54ECh. 12.5 - Prob. 55ECh. 12.5 - Prob. 56ECh. 12.5 - Prob. 57ECh. 12.5 - Prob. 58ECh. 12.5 - Prob. 59ECh. 12.5 - Prob. 60ECh. 12.5 - What percentage of the items lie within 1.25...Ch. 12.5 - Prob. 62ECh. 12 - Visits to Social Networking Sites The table shows...Ch. 12 - Cheaters Never Learn The table here shows the...Ch. 12 - Use this information for Exercises 3 and 4. For...Ch. 12 - Prob. 4TCh. 12 - College Endowment AssetsThe table shows the top...Ch. 12 - College Endowment Assets The table shows the top...Ch. 12 - College Endowment Assets The table shows the top...Ch. 12 - Prob. 8TCh. 12 - Pediatrics Patients Khalida worked the 22 weekdays...Ch. 12 - Prob. 10TCh. 12 - In Exercises 11-14, find the indicated measures...Ch. 12 - In Exercises 11-14, find the indicated measures...Ch. 12 - In Exercises 11-14, find the indicated measures...Ch. 12 - Prob. 14TCh. 12 - Exam Scores in a Criminal Justice Class The...Ch. 12 - Prob. 16TCh. 12 - Use the stem-and-leaf display below for Exercises...Ch. 12 - Prob. 18TCh. 12 - Use the stem-and-leaf display below for Exercises...Ch. 12 - Use the stem-and-leaf display below for...Ch. 12 - Use the stem-and-leaf display below for...Ch. 12 - Prob. 22TCh. 12 - Triple Jump ChampionsAll Summer Olympic...Ch. 12 - Prob. 24TCh. 12 - Season Statistics in Major League Baseball The...Ch. 12 - Season Statistics in Major League Baseball The...Ch. 12 - Season Statistics in Major League Baseball The...Ch. 12 - Prob. 28TCh. 12 - Remission Data for Cocaine and Marijuana Addiction...Ch. 12 - Remission Data for Cocaine and Marijuana Addiction...
Knowledge Booster


Learn more about
Need a deep-dive on the concept behind this application? Look no further. Learn more about this topic, subject and related others by exploring similar questions and additional content below.Similar questions
- 9 (Portfolio allocation) Suppose R₁ and R2 are returns of 2 assets and with expected return and variance respectively r₁ and 72 and variance-covariance σ2, 0%½ and σ12. Find −∞ ≤ w ≤ ∞ such that the portfolio wR₁ + (1 - w) R₂ has the smallest risk.arrow_forward7 (Multivariate random variable) Suppose X, €1, €2, €3 are IID N(0, 1) and Y2 Y₁ = 0.2 0.8X + €1, Y₂ = 0.3 +0.7X+ €2, Y3 = 0.2 + 0.9X + €3. = (In models like this, X is called the common factors of Y₁, Y₂, Y3.) Y = (Y1, Y2, Y3). (a) Find E(Y) and cov(Y). (b) What can you observe from cov(Y). Writearrow_forward1 (VaR and ES) Suppose X ~ f(x) with 1+x, if 0> x > −1 f(x) = 1−x if 1 x > 0 Find VaRo.05 (X) and ES0.05 (X).arrow_forward
- (^) k Recall that for numbers 0 ≤ k ≤ n the binomial coefficient (^) is defined as n! k! (n−k)! Question 1. (1) Prove the following identity: (22) + (1121) = (n+1). (2) Use the identity above to prove the binomial theorem by induction. That is, prove that for any a, b = R, n (a + b)" = Σ (^) an- n-kyk. k=0 n Recall that Σ0 x is short hand notation for the expression x0+x1+ +xn- (3) Fix x = R, x > 0. Prove Bernoulli's inequality: (1+x)" ≥1+nx, by using the binomial theorem. - Question 2. Prove that ||x| - |y|| ≤ |x − y| for any real numbers x, y. Question 3. Assume (In) nEN is a sequence which is unbounded above. That is, the set {xn|nЄN} is unbounded above. Prove that there are natural numbers N] k for all k Є N. be natural numbers (nk Є N). Prove thatarrow_forwardQuestion content area top Part 1 Find the measure of ABC for the congruent triangles ABC and Upper A prime Upper B prime Upper C primeA′B′C′. 79 degrees79° 1533 2930 Part 1 m ABCequals=enter your response heredegreesarrow_forwardJoy is making Christmas gifts. She has 6 1/12 feet of yarn and will need 4 1/4 to complete our project. How much yarn will she have left over compute this solution in two different ways arrow_forward
- Solve for X. Explain each step. 2^2x • 2^-4=8arrow_forwardFind the range and all the answers. Remark that the range isn’t between -(pi/2) and (pi/2)arrow_forwardOne hundred people were surveyed, and one question pertained to their educational background. The results of this question and their genders are given in the following table. Female (F) Male (F′) Total College degree (D) 30 20 50 No college degree (D′) 30 20 50 Total 60 40 100 If a person is selected at random from those surveyed, find the probability of each of the following events.1. The person is female or has a college degree. Answer: equation editor Equation Editor 2. The person is male or does not have a college degree. Answer: equation editor Equation Editor 3. The person is female or does not have a college degree.arrow_forward
arrow_back_ios
SEE MORE QUESTIONS
arrow_forward_ios
Recommended textbooks for you

 Glencoe Algebra 1, Student Edition, 9780079039897...AlgebraISBN:9780079039897Author:CarterPublisher:McGraw Hill
 Big Ideas Math A Bridge To Success Algebra 1: Stu...AlgebraISBN:9781680331141Author:HOUGHTON MIFFLIN HARCOURTPublisher:Houghton Mifflin Harcourt
Glencoe Algebra 1, Student Edition, 9780079039897...
Algebra
ISBN:9780079039897
Author:Carter
Publisher:McGraw Hill
Big Ideas Math A Bridge To Success Algebra 1: Stu...
Algebra
ISBN:9781680331141
Author:HOUGHTON MIFFLIN HARCOURT
Publisher:Houghton Mifflin Harcourt
The Shape of Data: Distributions: Crash Course Statistics #7; Author: CrashCourse;https://www.youtube.com/watch?v=bPFNxD3Yg6U;License: Standard YouTube License, CC-BY
Shape, Center, and Spread - Module 20.2 (Part 1); Author: Mrmathblog;https://www.youtube.com/watch?v=COaid7O_Gag;License: Standard YouTube License, CC-BY
Shape, Center and Spread; Author: Emily Murdock;https://www.youtube.com/watch?v=_YyW0DSCzpM;License: Standard Youtube License