a
Interpretation:
Total annual parts and logistics cost for each supplier.
Concept Introduction:
The lot sizing rule consists of lot-for-lot, Fixed order quantity and Fixed period quantity. Out of all lot sizing rule, lot-for-lot rule results in least inventory because the order is planned and released according to net requirement of that particular week. A fixed order quantity is an inventory system in which a firm orders a fixed lot size i.e. the order quantity remains the same when ordered every time.
a
Explanation of Solution
| Data | Supplier A | Supplier L |
| Procurement cost/ unit, P | $11.80 | $10.85 |
| Tariff cost/ unit, | $0.00 | $0.46 |
| Unit transportation cost, | $0.90 | $1.25 |
| Order cost/ order, | $155 | $195 |
| Holding cost per unit, | $1.45 | $1.10 |
| Lead time, L | 45 | 100 |
The different cost components that are involved in this case are:
Compute these costs for all the three suppliers and select based on the least total cost of the supply chain.
The following formulae will be used:
Total procurement cost = D.P
Total tariff cost =
Total transportation cost =
Annual ordering cost =
Annual carrying cost =
Annual pipeline inventory cost =
Where, D= annual demand, P= procurement cost per unit,
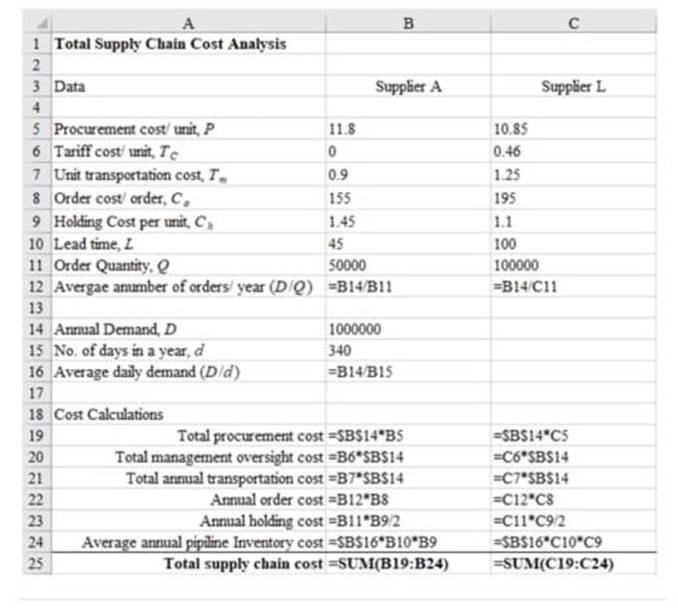
Note the computations done in the following Excel format.
| Total supply chain cost analysis | ||
| Data | Supplier A | Supplier L |
| Procurement cost/ unit, P | $11.80 | $10.85 |
| Tariff cost/ unit, | $0.00 | $0.46 |
| Unit transportation cost, | $0.90 | $1.25 |
| Order cost/ order, | $155 | $195 |
| Holding cost per unit, | $1.45 | $1.10 |
| Lead time, L | 45 | 100 |
| Order quantity | 50000 | 100000 |
| Average number of orders/ year (D/Q) | 20 | 10 |
| Annual demand, D | 1000000 | |
| No. of days in a year, d | 340 | |
| Average daily demand (D/d) | 2941 | |
| Cost calculations | ||
| Total procurement cost | $11,800,000.00 | $10,850,000.00 |
| Total management oversight cost | $0.00 | $460,000.00 |
| Total annual transportation cost | $900,000.00 | $1,250,000.00 |
| Annual order cost | $3,100 | $1,950 |
| Annual holding cost | $36,250.00 | $55,000.00 |
| Average annual pipeline Inventory cost | $191,911.76 | $323,529.41 |
| Total supply chain cost | $12,931,261.76 | $12,940,479.41 |
The following is the formulated excel sheet calculations as shown below:

b
Interpretation:
Recommendation on order quantity
Concept Introduction:
The lot sizing rule consists of lot-for-lot, Fixed order quantity and Fixed period quantity. Out of all lot sizing rule, lot-for-lot rule results in least inventory because the order is planned and released according to net requirement of that particular week. A fixed order quantity is an inventory system in which a firm orders a fixed lot size i.e. the order quantity remains the same when ordered every time.
b
Explanation of Solution
Based on the minimum total cost, the correct choice should be the Supplier A with Q = 50,000.
c
Interpretation:
Criteria for choosing supplier and quantity
Concept Introduction:
The lot sizing rule consists of lot-for-lot, Fixed order quantity and Fixed period quantity. Out of all lot sizing rule, lot-for-lot rule results in least inventory because the order is planned and released according to net requirement of that particular week. A fixed order quantity is an inventory system in which a firm orders a fixed lot size i.e. the order quantity remains the same when ordered every time.
c
Explanation of Solution
Following are some of the criteria other than then total cost. The relevant metrics for measurement are also mentioned in the following table.
| Criteria | Metric |
| Quality | Sigma level |
| Reliability | Average service level |
| Capacity | Percentage utilization |
| Delivery adherence | Variability in lead time |
d
Interpretation:
Recommendation for supplier who is not awarded the brake pad order..
Concept Introduction:
The lot sizing rule consists of lot-for-lot, Fixed order quantity and Fixed period quantity. Out of all lot sizing rule, lot-for-lot rule results in least inventory because the order is planned and released according to net requirement of that particular week. A fixed order quantity is an inventory system in which a firm orders a fixed lot size i.e. the order quantity remains the same when ordered every time.
d
Explanation of Solution
Supplier L should be given a target of reducing the procurement cost per unit by, say, 3%. Even with a 3% reduction of procurement cost per unit, it can compete with supplier A based on the total cost. This is shown below.
| Total supply chain cost analysis | ||
| Data | Supplier A | Supplier L |
| Procurement cost/ unit, P | $11.80 | $10.85 |
| Tariff cost/ unit, | $0.00 | $0.46 |
| Unit transportation cost, | $0.90 | $1.25 |
| Order cost/ order, | $155 | $195 |
| Holding cost per unit, | $1.45 | $1.10 |
| Lead time, L | 45 | 100 |
| Order quantity | 50000 | 100000 |
| Average number of orders/ year (D/Q) | 20 | 10 |
| Annual demand, D | 1000000 | |
| No. of days in a year, d | 340 | |
| Average daily demand (D/d) | 2941 | |
| Cost calculations | ||
| Total procurement cost | $11,800,000.00 | $10,524,500.00 |
| Total management oversight cost | $0.00 | $460,000.00 |
| Total annual transportation cost | $900,000.00 | $1,250,000.00 |
| Annual order cost | $3,100 | $1,950 |
| Annual holding cost | $36,250.00 | $55,000.00 |
| Average annual pipeline Inventory cost | $191,911.76 | $323,529.41 |
| Total supply chain cost | $12,931,261.76 | $12,614,979.41 |
Want to see more full solutions like this?
Chapter 12 Solutions
OM6 ONLINE-LMS INTEGRATED ACCESS
- northeastern insurance company is considering opening an office in the US. The two cities under consideration are going to be Philadelphia New York. Factor ratings (higher scores are better) are in the table. The best location for northeastern insurance company to open would be which with a total weighted score of ? (response rounded to two decimal places)arrow_forwardWhen football fans watch a game, they believe the other side commits more infractions on the field than does their own team. This favoritism can best be termed _____. Group of answer choices A. ethnocentrism B. the fundamental attribution error C. the affiliation bias D. marginalizationarrow_forwardWhen football fans watch a game, they believe the other side commits more infractions on the field than does their own team. This favoritism can best be termed _____. Group of answer choices ethnocentrism the fundamental attribution error the affiliation bias marginalizationarrow_forward
- Which of the following best describes the differences between egalitarianism and hierarchy as cultural values in negotiation? Group of answer choices A. Egalitarian cultures communicate directly; hierarchical cultures communicate indirectly. B. Egalitarian cultures treat people equally; hierarchical cultures discriminate among people. C. Egalitarian cultures divide things equally; hierarchical cultures divide things according to merit and status. D. Egalitarian cultures believe that status is permeable through effort and achievement; hierarchical cultures believe that superiors should take care of the needs of subordinates.arrow_forwardWhich of the following best describes the differences between individualism and collectivism as cultural values in negotiation? Group of answer choices A. Individualists see themselves as autonomous entities; collectivists see themselves in relation to others. B. Individualists prefer to work in groups; collectivists prefer to work alone. C. Individualists are cooperative; collectivists are competitive. D. Individualists focus on relationships; collectivists focus on money.arrow_forwardWhen it comes to resolving conflict, managers from hierarchical cultures prefer _____. Group of answer choices A. to attribute a disagreeable person's behavior to an underlying disposition and desire formal dispute resolution procedures B. an interests model that relies on resolving underlying conflicts C. to regulate behavior via public shaming D. to defer to a higher status personarrow_forward
- The tripartite model of culture is based on three cultural prototypes that represent negotiators’ self-views and are highly correlated with particular geographic regions. Give an example of the three. Face Dignity Honorarrow_forwardThe personality and unique character of a social group is best known as its _____ and includes the values and norms shared by its members and encompasses the structure of its social, political, economic, and religious institutions. Group of answer choices group identity group potency group stereotype culturearrow_forwardagree or disagree with this post Face - “Face” or dignity in a negotiation has been called “one of an individual’s most sacred possessions.”102 Face is the value a person places on his or her public image, reputation, and status vis-à-vis other people in the negotiation. Direct threats to face in a negotiation include making ultimatums, criticisms, challenges, and insults (Thompson, 2019). A good example of face is when I go to the negotiation table with a counterpart that is known to be difficult or not as knowledgeable about the category as they should be, my approach wouldn't be to point out their weakness, I will respect their thought process, show consideration for their perspective, all while guiding the conversation in the direction of my intended negotiation strategy in hopes to achieve my desired outcome. Dignity - endorses views such as, “People should stand up for what they believe in, even when others disagree,” and “How much a person respects oneself is far more…arrow_forward
- 16:53 ◄ Mail 5G CSTUDY_Jan25_SCMH_O...Final_20250220143201.pdf CHOOSING FORECASTING MODELS gradienting are more mode. Yet when selecting a forecasting method, the door forecasts in fact, each of the three methods has different strength and can play important ing importance of the factors, such as the index and cast model, or a unified approach, ch del runs individual series separately A galable manufacturer is facing changes with demand fuctuations due to economiyapply make changes. Comment on why this has been the case and propose a forecasting approach that can be utilised t Question 13 ashit from a batch production process to a continuous flows to enhance efficiency. Critically analyse the trade- A public hospital in Free State is experiencing increasing patient wait times due to limited operacity. The hospital management is considering either expanding existing facilities orating more efficient Question 1.5 A farming consponsible for planting grain crops in Free State As expected…arrow_forwardHow can a college basketball coach use lean system strategies to improve the team's performance and win the national championship? What wastes can be eliminated from the team's training and equipment? How can performance data be used to adjust the team's strategy and tactics?arrow_forwardHow much does self-awareness influence the Interpersonal Trust Scale's results?arrow_forward
 Purchasing and Supply Chain ManagementOperations ManagementISBN:9781285869681Author:Robert M. Monczka, Robert B. Handfield, Larry C. Giunipero, James L. PattersonPublisher:Cengage Learning
 Contemporary MarketingMarketingISBN:9780357033777Author:Louis E. Boone, David L. KurtzPublisher:Cengage Learning


