
a
Interpretation:
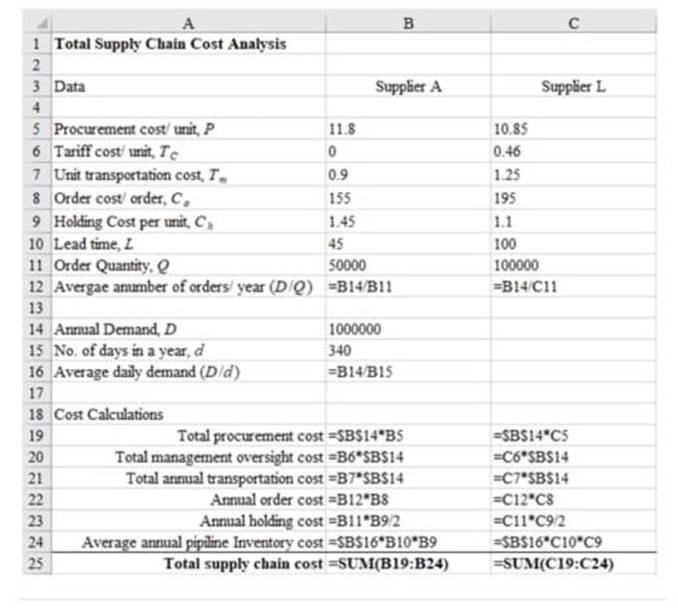
Total annual parts and logistics cost for each supplier.
Concept Introduction:
The lot sizing rule consists of lot-for-lot, Fixed order quantity and Fixed period quantity. Out of all lot sizing rule, lot-for-lot rule results in least inventory because the order is planned and released according to net requirement of that particular week. A fixed order quantity is an inventory system in which a firm orders a fixed lot size i.e. the order quantity remains the same when ordered every time.
a
Explanation of Solution
| Data | Supplier A | Supplier L |
| Procurement cost/ unit, P | $11.80 | $10.85 |
| Tariff cost/ unit, | $0.00 | $0.46 |
| Unit transportation cost, | $0.90 | $1.25 |
| Order cost/ order, | $155 | $195 |
| Holding cost per unit, | $1.45 | $1.10 |
| Lead time, L | 45 | 100 |
The different cost components that are involved in this case are:
Compute these costs for all the three suppliers and select based on the least total cost of the supply chain.
The following formulae will be used:
Total procurement cost = D.P
Total tariff cost =
Total transportation cost =
Annual ordering cost =
Annual carrying cost =
Annual pipeline inventory cost =
Where, D= annual demand, P= procurement cost per unit,
Note the computations done in the following Excel format.
| Total supply chain cost analysis | ||
| Data | Supplier A | Supplier L |
| Procurement cost/ unit, P | $11.80 | $10.85 |
| Tariff cost/ unit, | $0.00 | $0.46 |
| Unit transportation cost, | $0.90 | $1.25 |
| Order cost/ order, | $155 | $195 |
| Holding cost per unit, | $1.45 | $1.10 |
| Lead time, L | 45 | 100 |
| Order quantity | 50000 | 100000 |
| Average number of orders/ year (D/Q) | 20 | 10 |
| Annual demand, D | 1000000 | |
| No. of days in a year, d | 340 | |
| Average daily demand (D/d) | 2941 | |
| Cost calculations | ||
| Total procurement cost | $11,800,000.00 | $10,850,000.00 |
| Total management oversight cost | $0.00 | $460,000.00 |
| Total annual transportation cost | $900,000.00 | $1,250,000.00 |
| Annual order cost | $3,100 | $1,950 |
| Annual holding cost | $36,250.00 | $55,000.00 |
| Average annual pipeline Inventory cost | $191,911.76 | $323,529.41 |
| Total supply chain cost | $12,931,261.76 | $12,940,479.41 |
The following is the formulated excel sheet calculations as shown below:
b
Interpretation:
Recommendation on order quantity
Concept Introduction:
The lot sizing rule consists of lot-for-lot, Fixed order quantity and Fixed period quantity. Out of all lot sizing rule, lot-for-lot rule results in least inventory because the order is planned and released according to net requirement of that particular week. A fixed order quantity is an inventory system in which a firm orders a fixed lot size i.e. the order quantity remains the same when ordered every time.
b
Explanation of Solution
Based on the minimum total cost, the correct choice should be the Supplier A with Q = 50,000.
c
Interpretation:
Criteria for choosing supplier and quantity
Concept Introduction:
The lot sizing rule consists of lot-for-lot, Fixed order quantity and Fixed period quantity. Out of all lot sizing rule, lot-for-lot rule results in least inventory because the order is planned and released according to net requirement of that particular week. A fixed order quantity is an inventory system in which a firm orders a fixed lot size i.e. the order quantity remains the same when ordered every time.
c
Explanation of Solution
Following are some of the criteria other than then total cost. The relevant metrics for measurement are also mentioned in the following table.
| Criteria | Metric |
| Quality | Sigma level |
| Reliability | Average service level |
| Capacity | Percentage utilization |
| Delivery adherence | Variability in lead time |
d
Interpretation:
Recommendation for supplier who is not awarded the brake pad order..
Concept Introduction:
The lot sizing rule consists of lot-for-lot, Fixed order quantity and Fixed period quantity. Out of all lot sizing rule, lot-for-lot rule results in least inventory because the order is planned and released according to net requirement of that particular week. A fixed order quantity is an inventory system in which a firm orders a fixed lot size i.e. the order quantity remains the same when ordered every time.
d
Explanation of Solution
Supplier L should be given a target of reducing the procurement cost per unit by, say, 3%. Even with a 3% reduction of procurement cost per unit, it can compete with supplier A based on the total cost. This is shown below.
| Total supply chain cost analysis | ||
| Data | Supplier A | Supplier L |
| Procurement cost/ unit, P | $11.80 | $10.85 |
| Tariff cost/ unit, | $0.00 | $0.46 |
| Unit transportation cost, | $0.90 | $1.25 |
| Order cost/ order, | $155 | $195 |
| Holding cost per unit, | $1.45 | $1.10 |
| Lead time, L | 45 | 100 |
| Order quantity | 50000 | 100000 |
| Average number of orders/ year (D/Q) | 20 | 10 |
| Annual demand, D | 1000000 | |
| No. of days in a year, d | 340 | |
| Average daily demand (D/d) | 2941 | |
| Cost calculations | ||
| Total procurement cost | $11,800,000.00 | $10,524,500.00 |
| Total management oversight cost | $0.00 | $460,000.00 |
| Total annual transportation cost | $900,000.00 | $1,250,000.00 |
| Annual order cost | $3,100 | $1,950 |
| Annual holding cost | $36,250.00 | $55,000.00 |
| Average annual pipeline Inventory cost | $191,911.76 | $323,529.41 |
| Total supply chain cost | $12,931,261.76 | $12,614,979.41 |
Want to see more full solutions like this?

- Marcela Valladolid needs to assign resources to a task on a new high-tech development project at Jonathon's Pool Supplies. According to her estimates, the task's work content (in hours) is 408. Marcela needs help in determining an appropriate number of resources to allocate to the task. Marcela read somewhere that, when it comes to project staffing, more is not always better. Assuming that the direct labor rate per hour is $93, the indirect and over head rate per unit time is $73.62, assigned resources are dedicated to the task full time, and that 0.02 hours of communication per coordination are required per link per hour worked, help Marcela by determining the following: What is the minimum total cost: What resource allocation minimizes the total cost: What is the minimum duration: What is the duration minimizing number of resources: If Marcela assigns 12 FTEs to the task, the task metrics would be: Total Cost: Total Duration: Note: enter durations to 1 decimal place and costs…arrow_forward1 point) Market Fresh Foods is looking to develop a new strategic plan. Guillermo Santiago has been developing a project plan and has identified the following tasks, precedence relations, normal task durations, and resource requirements. Guillermo has studied project management at the University of Portland and knows that the makespan of the project may be determined from the information in the table using the critical path method. Guillermo also learned a simple heuristic for evaluating resource sufficiency. Help Guillermo by answering the following related assuming 3 workers per week and a due date of 302.8: Project Work Content: Total Resource Capacity: Minimum due date for which 3 resources is sufficient: Minimum resource level that could make due date of 302.8 feasible:arrow_forwardHow an individual attending a university can help the development of a country?arrow_forward
- What are the job description or role in Operations management? Please answer at your own easy words.arrow_forwardI am currently working as a Sub Assistant Manager at Advance Personal Care Limited (APCL), a concern of Pran Group. I hold a Bachelor of Pharmacy (Professional) degree. I recently came across a job posting on BD Jobs for a position in Project Management within Quality Operations. I want to apply for this role and need to update my CV accordingly. Could you please guide me on what key information, achievements, and skills I should add or highlight in my CV to align with this new role? Note that i have 8 months experience on this role. Please write at your own easy words. Please don't use Ai answering this question. I will rate you positive if you do so.arrow_forwardI am currently working as a Sub Assistant Manager at Advance Personal Care Limited (APCL), a concern of Pran Group. I hold a Bachelor of Pharmacy (Professional) degree. I recently came across a job posting on BD Jobs for a position in Project Management within Quality Operations. I want to apply for this role and need to update my CV accordingly. Could you please guide me on what key information, achievements, and skills I should add or highlight in my CV to align with this new role? Note that i have 8 months experience on this role. Please don't use Ai answering this question. I will rate you positive if you do so.arrow_forward
- SIPOC Process Supplier Machines Quality Group Leader Double Output Customers Inputs Solutions End of batch Inspection verification Scrap evaluation Sampling Verification Batch complete Evaluation Completed Quality Group Leader Samplings verified Quality Samplings verified Quality Barcode programed Mechanic Parameters registered Quality Line verified Quality Line Verified Quality Second verification Barcode Parameters Line Inspection Second Line Inspection Lot and Expiration Date Quality Quality Mechanic Mechanic Quality Machines Quality Group Leader Quality Quality Quality Batch Verification Process complete Revision Review Sampling Verification Barcode Scanner Machine Parameters Line Clearance Line Clearance Machine Remove Lot Status Verification Close floor Final MFG Review Final QA Review Close Batch Machine removed Lot verified Floor closed MFG Reviewed Process reviewed Batch closed Mechanic Group Leader Quality Quality Quality Group Leaderarrow_forwardAn assessment of gender leadership and corporate culture.Kindly provide the following, citing it using in-text referencing: • A thorough exploration of gender dynamics and concepts.• Creating a clear plan to address gender bias and promote inclusive leadership.• An examination of female leadership dynamics and their impact on performance. • Comprehensive justification behind the proposal.arrow_forwardAssessment of Strategic Leadership and Global Context Provide the below in detail:· A comprehensive analysis of the current strategy,· Develop a new comprehensive strategic leadership framework that tackles the challenges of leading a global company while balancing global standards and responding to local context and challenges.· Justify a framework by drawing on and applying relevant theories of strategic leadership and global management.· It needs substantial depth and detail.· Conduct a critical evaluation of strategic leadership in a global context.arrow_forward
 Purchasing and Supply Chain ManagementOperations ManagementISBN:9781285869681Author:Robert M. Monczka, Robert B. Handfield, Larry C. Giunipero, James L. PattersonPublisher:Cengage Learning
 Contemporary MarketingMarketingISBN:9780357033777Author:Louis E. Boone, David L. KurtzPublisher:Cengage Learning