
Gen Combo Ll Applied Statistics In Business & Economics; Connect Access Card
6th Edition
ISBN: 9781260260632
Author: David Doane, Lori Seward Senior Instructor of Operations Management
Publisher: McGraw-Hill Education
expand_more
expand_more
format_list_bulleted
Concept explainers
Videos
Textbook Question
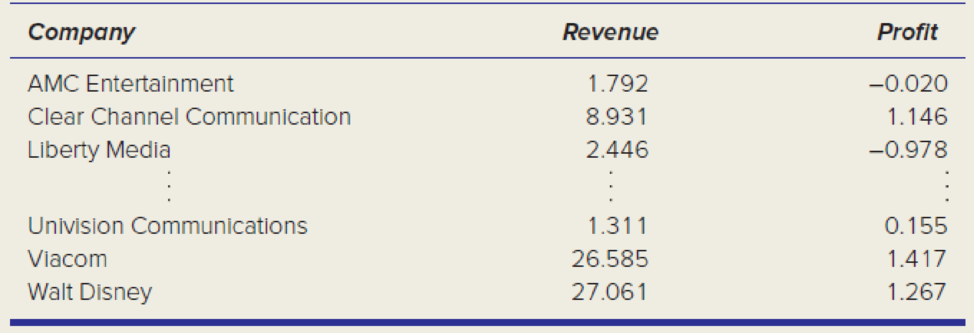
Chapter 12, Problem 78CE
Below are revenue and profit (both in $ billions) for nine large entertainment companies. (a) Make a
Revenue and Profit of Entertainment Companies (n = 9)
Expert Solution & Answer
Want to see the full answer?
Check out a sample textbook solution
Students have asked these similar questions
Write STATA codes which will generate the outcomes in the questions
& submit the output for each question only when indicated below
i.
ii.
iii.
iv.
V.
Write a code which will allow STATA to go to your favorite folder
to access your files. Load the birthweight1.dta dataset from your
favorite folder and save it under a different filename to protect
data integrity. Call the new dataset babywt.dta (make sure to use
the replace option).
Verify that it contains 2,998 observations and 8 variables. Include
the output of this code.
Are there missing observations for variable(s) for the variables
called bwght, faminc, cigs? How would you know? (You may use
more than one code to show your answer(s)) Include the output
of your code (s).
Write the definitions of these variables: bwght, faminc, male,
white, motheduc,cigs; which of these variables are categorical?
[Hint: use the labels of the variables & the browse command]
Who is this dataset about? Who can use this dataset to answer
what kind of…
Apply STATA commands & submit the output for each question only
when indicated below
İ.
ii.
iii.
iv.
V.
Apply the command summarize on variables bwght and faminc.
What is the average birthweight of babies and family income of
the respondents? Include the output of this code.
Apply the tab command on the variable called male. How many
of the babies and what share of babies are male? Include the
output of this code.
Find the summary statistics (i.e. use the sum command) of the
variables bwght and faminc if the babies are white. Include the
output of this code.
Find the summary statistics (i.e. use the sum command) of the
variables bwght and faminc if the babies are male but not white.
Include the output of this code.
Using your answers to previous subparts of this question: What
is the difference between the average birthweight of a baby who
is male and a baby who is male but not white? What can you say
anything about the difference in family income of the babies that
are male and male…
A public health researcher is studying the impacts of nudge marketing techniques on shoppers vegetables
Chapter 12 Solutions
Gen Combo Ll Applied Statistics In Business & Economics; Connect Access Card
Ch. 12.1 - For each sample, do a test for zero correlation....Ch. 12.1 - Instructions for Exercises 12.2 and 12.3: (a) Make...Ch. 12.1 - Prob. 3SECh. 12.1 - Prob. 4SECh. 12.1 - Instructions for exercises 12.412.6: (a) Make a...Ch. 12.1 - Prob. 6SECh. 12.2 - (a) Interpret the slope of the fitted regression...Ch. 12.2 - (a) Interpret the slope of the fitted regression...Ch. 12.2 - Prob. 9SECh. 12.2 - (a) Interpret the slope of the fitted regression...
Ch. 12.2 - (a) Interpret the slope of the fitted regression...Ch. 12.3 - Prob. 12SECh. 12.3 - Prob. 13SECh. 12.3 - The regression equation Credits = 15.4 .07 Work...Ch. 12.3 - Below are fitted regressions for Y = asking price...Ch. 12.3 - Refer back to the regression equation in exercise...Ch. 12.3 - Refer back to the regression equation in exercise...Ch. 12.4 - Instructions for exercises 12.18 and 12.19: (a)...Ch. 12.4 - Instructions for exercises 12.18 and 12.19: (a)...Ch. 12.4 - Instructions for exercises 12.2012.22: (a) Use...Ch. 12.4 - Instructions for exercises 12.2012.22: (a) Use...Ch. 12.4 - Instructions for exercises 12.2012.22: (a) Use...Ch. 12.5 - Instructions for exercises 12.23 and 12.24: (a)...Ch. 12.5 - Instructions for exercises 12.23 and 12.24: (a)...Ch. 12.5 - A regression was performed using data on 32 NFL...Ch. 12.5 - A regression was performed using data on 16...Ch. 12.6 - Below is a regression using X = home price (000),...Ch. 12.6 - Below is a regression using X = average price, Y =...Ch. 12.6 - Instructions for exercises 12.2912.31: (a) Use...Ch. 12.6 - Instructions for exercises 12.2912.31: (a) Use...Ch. 12.6 - Instructions for exercises 12.2912.31: (a) Use...Ch. 12.7 - Refer to the Weekly Earnings data set below. (a)...Ch. 12.7 - Prob. 33SECh. 12.8 - Prob. 34SECh. 12.8 - Prob. 35SECh. 12.9 - Calculate the standardized residual ei and...Ch. 12.9 - Prob. 37SECh. 12.9 - An estimated regression for a random sample of...Ch. 12.9 - An estimated regression for a random sample of...Ch. 12.9 - Prob. 40SECh. 12.9 - Prob. 41SECh. 12.9 - Prob. 42SECh. 12.9 - Prob. 43SECh. 12.11 - Prob. 44SECh. 12.11 - Prob. 45SECh. 12 - (a) How does correlation analysis differ from...Ch. 12 - (a) What is a simple regression model? (b) State...Ch. 12 - (a) Explain how you fit a regression to an Excel...Ch. 12 - (a) Explain the logic of the ordinary least...Ch. 12 - (a) Why cant we use the sum of the residuals to...Ch. 12 - Prob. 6CRCh. 12 - Prob. 7CRCh. 12 - Prob. 8CRCh. 12 - Prob. 9CRCh. 12 - Prob. 10CRCh. 12 - Prob. 11CRCh. 12 - Prob. 12CRCh. 12 - (a) What is heteroscedasticity? Identify its two...Ch. 12 - (a) What is autocorrelation? Identify two main...Ch. 12 - Prob. 15CRCh. 12 - Prob. 16CRCh. 12 - (a) What is a log transform? (b) What are its...Ch. 12 - (a) When is logistic regression needed? (b) Why...Ch. 12 - Prob. 46CECh. 12 - Prob. 47CECh. 12 - Prob. 48CECh. 12 - Instructions: Choose one or more of the data sets...Ch. 12 - Prob. 50CECh. 12 - Prob. 51CECh. 12 - Prob. 52CECh. 12 - Prob. 53CECh. 12 - Instructions: Choose one or more of the data sets...Ch. 12 - Instructions: Choose one or more of the data sets...Ch. 12 - Instructions: Choose one or more of the data sets...Ch. 12 - Prob. 57CECh. 12 - Prob. 58CECh. 12 - Prob. 59CECh. 12 - Prob. 60CECh. 12 - Prob. 61CECh. 12 - Prob. 62CECh. 12 - Prob. 63CECh. 12 - Prob. 64CECh. 12 - Prob. 65CECh. 12 - In the following regression, X = weekly pay, Y =...Ch. 12 - Prob. 67CECh. 12 - In the following regression, X = total assets (...Ch. 12 - Prob. 69CECh. 12 - Below are percentages for annual sales growth and...Ch. 12 - Prob. 71CECh. 12 - Prob. 72CECh. 12 - Prob. 73CECh. 12 - Simple regression was employed to establish the...Ch. 12 - Prob. 75CECh. 12 - Prob. 76CECh. 12 - Prob. 77CECh. 12 - Below are revenue and profit (both in billions)...Ch. 12 - Below are fitted regressions based on used vehicle...Ch. 12 - Below are results of a regression of Y = average...Ch. 12 - Prob. 81CE
Knowledge Booster


Learn more about
Need a deep-dive on the concept behind this application? Look no further. Learn more about this topic, statistics and related others by exploring similar questions and additional content below.Similar questions
- The director of admissions at Kinzua University in Nova Scotia estimated the distribution of student admissions for the fall semester on the basis of past experience. Admissions Probability 1,100 0.5 1,400 0.4 1,300 0.1 Click here for the Excel Data File Required: What is the expected number of admissions for the fall semester? Compute the variance and the standard deviation of the number of admissions. Note: Round your standard deviation to 2 decimal places.arrow_forwardA pollster randomly selected four of 10 available people. Required: How many different groups of 4 are possible? What is the probability that a person is a member of a group? Note: Round your answer to 3 decimal places.arrow_forwardWind Mountain is an archaeological study area located in southwestern New Mexico. Potsherds are broken pieces of prehistoric Native American clay vessels. One type of painted ceramic vessel is called Mimbres classic black-on-white. At three different sites the number of such sherds was counted in local dwelling excavations. Test given. Site I Site II Site III 63 19 60 43 34 21 23 49 51 48 11 15 16 46 26 20 31 Find .arrow_forward
- Rothamsted Experimental Station (England) has studied wheat production since 1852. Each year many small plots of equal size but different soil/fertilizer conditions are planted with wheat. At the end of the growing season, the yield (in pounds) of the wheat on the plot is measured. Suppose for a random sample of years, one plot gave the following annual wheat production (in pounds): 4.46 4.21 4.40 4.81 2.81 2.90 4.93 3.54 4.16 4.48 3.26 4.74 4.97 4.02 4.91 2.59 Use a calculator to verify that the sample variance for this plot is . Another random sample of years for a second plot gave the following annual wheat production (in pounds): 3.89 3.81 3.95 4.07 4.01 3.73 4.02 3.78 3.72 3.96 3.62 3.76 4.02 3.73 3.94 4.03 Use a calculator to verify that the sample variance for this plot is . Suppose that we test the claim using that the population variance of annual wheat production for the first plot is larger…arrow_forwardIt is thought that prehistoric Native Americans did not take their best tools, pottery, and household items when they visited higher elevations for their summer camps. It is hypothesized that archaeological sites tend to lose their cultural identity and specific cultural affiliation as the elevation of the site increases. Let x be the elevation (in thousands of feet) for an archaeological site in the southwestern United States. Let y be the percentage of unidentified artifacts (no specific cultural affiliation) at a given elevation. Suppose that the following data were obtained for a collection of archaeological sites in New Mexico: x 5.50 6.00 6.75 7.00 7.75 y 37 38 92 70 99 Find the equation of the least squares line . Round a and b to three decimal places.arrow_forwardA fitness trainer wants to estimate the effect of fitness activities on muscle mass for different weight categories of club members. They choose the most popular fitness classes at the gym: yoga, circuit training, and high-intensity interval training (HIIT). Suppose that the weights of club members are separated into three levels: under 155 pounds, 155 – 200 pounds, and over 200 pounds. Draw a flow chart showing the design of this experiment.arrow_forward
- The systolic blood pressure of individuals is thought to be related to both age and weight. Let the systolic blood pressure, age, and weight be represented by the variables x1, x2, and x3, respectively. Suppose that Minitab was used to generate the following descriptive statistics, correlations, and regression analysis for a random sample of 15 individuals. Descriptive Statistics Variable N Mean Median TrMean StDev SE Mean x 1 15 154.14 154.34 154.14 3.842 0.992000 x 2 15 59.69 60.19 59.69 1.462 0.377487 x 3 15 205.55 204.75 205.55 4.558 1.176871 Variable Minimum Maximum Q1 Q3 x 1 125 178 141.803 167.244 x 2 41 80 47.754 78.415 x 3 126 240 140.395 224.008 Correlations (Pearson) x 1 x 2 x 2 0.892 x 3 0.839 0.567 Regression Analysis The regression equation is x 1 = 0.883 + 1.257x2 + 0.871x3 Predictor Coef StDev T P Constant 0.883 0.635 1.39 0.095 x 2 1.257 0.635 1.98 0.036 x 3 0.871 0.419 2.08 0.030 S = 0.428 R-sq = 92.7 %…arrow_forwardAccording to health professionals, a person’s weight is expected to increase with age. To examine that statement, a nutritionist collected data from 11 random females from different age categories between the ages of 21 and 43. In the following table, x is the age of a person and y is the weight in pounds. x, age 21 24 27 29 31 33 35 38 40 42 43 y, weight in lb 121.4 122.3 130.3 131.7 133.3 134.6 136.7 138.4 140.3 142.0 145.1 Select the correct graph of the least-squares line on a scatter diagram.arrow_forwardLet x be a random variable that represents the percentage of successful free throws a professional basketball player makes in a season. Let y be a random variable that represents the percentage of successful field goals a professional basketball player makes in a season. A random sample of n = 6 professional basketball players gave the following information. x 82 69 73 84 74 64 y 42 48 46 46 46 42 Verify that ∑x =446, ∑y =270, ∑x2 =33,442, ∑y2 =12,180, ∑xy =20,070, and r = 0, and find the critical value for a test using a 5% level of significance claiming that ρis not equal than zero. Round your answer to three decimal places.arrow_forward
- Let x be a random variable that represents the percentage of successful free throws a professional basketball player makes in a season. Let y be a random variable that represents the percentage of successful field goals a professional basketball player makes in a season. A random sample of n = 6 professional basketball players gave the following information. x 75 72 75 81 74 81 y 46 39 42 47 49 50 Verify that Se ࣈ 3.591,a ࣈ –10.145, bࣈ0.729, and , and find the predicted percentage of successful field goals for a player with x= 88%successful free throws. Round your answer to the nearest tenth of a percentarrow_forwardAn editor wants to analyze if there is a significant difference in the ratings of books in four different genres. Random samples of book ratings were collected for four different genres. The editor recorded ratings in a 0 to 10 scale in the following table. Fiction Novel Biography Science&Technology 8.5 8.4 6.2 9.1 5.3 5.3 5.5 4.3 7.7 4.2 7.0 9.7 5.1 9.8 9.3 5.2 6.9 8.6 6.7 7.9 4.8 7.1 6.9 8.4 Shall we reject or not reject the claim that there are no differences among the population means of book ratings for the different genres? Use.arrow_forwardPeggy conducted a study to identify the randomness of rainy days in fall. For 15 days, she recorded whether it rained that day or not. They denoted a rainy day with the letter R, a day without rain with the letter N. R N N R R N N R R N N R R R R Test the sequence for randomness. Use .arrow_forward
arrow_back_ios
SEE MORE QUESTIONS
arrow_forward_ios
Recommended textbooks for you
 Glencoe Algebra 1, Student Edition, 9780079039897...AlgebraISBN:9780079039897Author:CarterPublisher:McGraw Hill
 Big Ideas Math A Bridge To Success Algebra 1: Stu...AlgebraISBN:9781680331141Author:HOUGHTON MIFFLIN HARCOURTPublisher:Houghton Mifflin Harcourt
 Trigonometry (MindTap Course List)TrigonometryISBN:9781305652224Author:Charles P. McKeague, Mark D. TurnerPublisher:Cengage Learning
 Algebra and Trigonometry (MindTap Course List)AlgebraISBN:9781305071742Author:James Stewart, Lothar Redlin, Saleem WatsonPublisher:Cengage Learning
 Trigonometry (MindTap Course List)TrigonometryISBN:9781337278461Author:Ron LarsonPublisher:Cengage Learning
Glencoe Algebra 1, Student Edition, 9780079039897...
Algebra
ISBN:9780079039897
Author:Carter
Publisher:McGraw Hill
Big Ideas Math A Bridge To Success Algebra 1: Stu...
Algebra
ISBN:9781680331141
Author:HOUGHTON MIFFLIN HARCOURT
Publisher:Houghton Mifflin Harcourt
Trigonometry (MindTap Course List)
Trigonometry
ISBN:9781305652224
Author:Charles P. McKeague, Mark D. Turner
Publisher:Cengage Learning
Algebra and Trigonometry (MindTap Course List)
Algebra
ISBN:9781305071742
Author:James Stewart, Lothar Redlin, Saleem Watson
Publisher:Cengage Learning
Trigonometry (MindTap Course List)
Trigonometry
ISBN:9781337278461
Author:Ron Larson
Publisher:Cengage Learning
Correlation Vs Regression: Difference Between them with definition & Comparison Chart; Author: Key Differences;https://www.youtube.com/watch?v=Ou2QGSJVd0U;License: Standard YouTube License, CC-BY
Correlation and Regression: Concepts with Illustrative examples; Author: LEARN & APPLY : Lean and Six Sigma;https://www.youtube.com/watch?v=xTpHD5WLuoA;License: Standard YouTube License, CC-BY