Videos
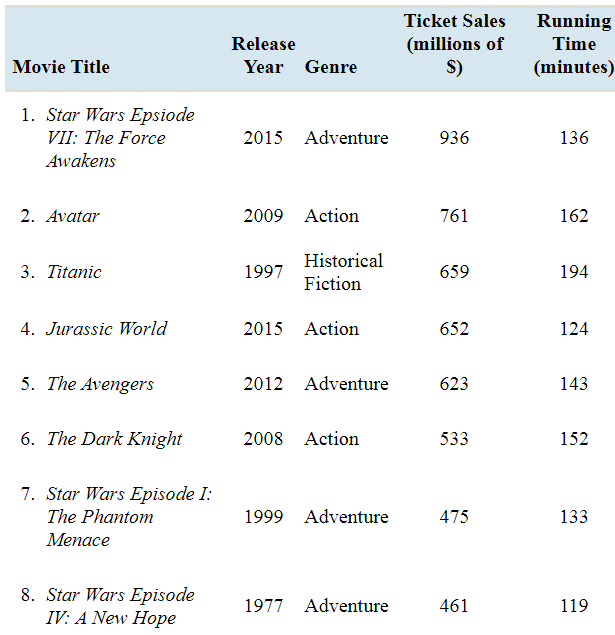
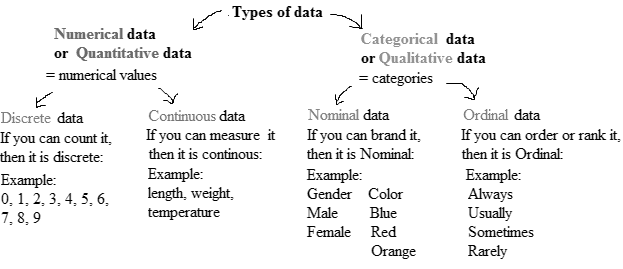
At the movies: The following table provides information about the top grossing movies of all time.
- Which of the columns represent qualitative variables?
- Which of the columns represent quantitative variables?
- Which of the columns represent nominal variables?
- Which of the columns represent ordinal variables?
a.
To identify:the columns that represent qualitative variables.
Answer to Problem 48E
The columns Movie Title and Genre represent qualitative variables.
Explanation of Solution
Given information:
| Movie Title | Release Year | Genre | Ticket Sales (millions of $) | Running Time (minutes) |
| 1. Star Wars Episode VII: The Force Awakens | 2015 | Adventure | 936 | 136 |
| 2. Avatars | 2009 | Action | 761 | 162 |
| 3. Titanic | 1997 | Historical Fiction | 659 | 194 |
| 4. Jurassic World | 2015 | Action | 652 | 124 |
| 5. The Avengers | 2012 | Adventure | 623 | 143 |
| 6. The Dark Knight | 2008 | Action | 533 | 152 |
| 7. Star Wars Episode I: The Phantom Menace | 1999 | Adventure | 475 | 133 |
| 8. Star Wars Episode IV: A New Hope | 1977 | Adventure | 461 | 119 |
| 9. Avengers: Age of Ultron | 2015 | Action | 459 | 141 |
| 10. The Dark Knight | 2012 | Action | 448 | 164 |
Concept Involved:
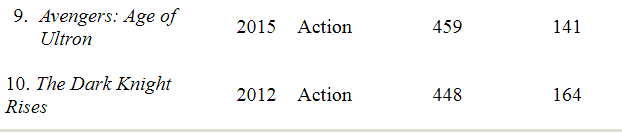
There are various methods of collecting information by sampling. Once the information has been collected, the collection is called a data set. Variables can be divided into two types: qualitative and quantitative. Qualitative variables are also called categorical variable, classify individuals into categories. Quantitative variables are numerical and tell how much of something there is.
Qualitative variables come in two types: ordinal variables and nominal variables.
Ordinal variables are qualitative variables whose categories have a natural ordering.
Nominal variables are qualitative variables whose categories have no natural ordering.
Quantitative variables can be either discrete or continuous.
Discrete variables are those whose possible values can be listed. Often, discrete variables result from counting something, so the possible values of the variable are 0, 1, 2 and so forth.
Continuous variables can, in principle, take on any value within some interval.
The variable which classifies individuals into categories is called qualitative variable, and the variable which provide information about quantity or number of something is quantitative variable. The Movie Title and Genre classifies the top grossing movies of all time.
Therefore, the columns Movie Title and Genre represent qualitative variables.
b.
To identify:the columns that represent quantitative variables.
Answer to Problem 48E
The columns Ticket Sales (millions of $) and Running Time (minutes) represent quantitative variables.
Explanation of Solution
Given information:
| Movie Title | Release Year | Genre | Ticket Sales (millions of $) | Running Time (minutes) |
| 1. Star Wars Episode VII: The Force Awakens | 2015 | Adventure | 936 | 136 |
| 2. Avatars | 2009 | Action | 761 | 162 |
| 3. Titanic | 1997 | Historical Fiction | 659 | 194 |
| 4. Jurassic World | 2015 | Action | 652 | 124 |
| 5. The Avengers | 2012 | Adventure | 623 | 143 |
| 6. The Dark Knight | 2008 | Action | 533 | 152 |
| 7. Star Wars Episode I: The Phantom Menace | 1999 | Adventure | 475 | 133 |
| 8. Star Wars Episode IV: A New Hope | 1977 | Adventure | 461 | 119 |
| 9. Avengers: Age of Ultron | 2015 | Action | 459 | 141 |
| 10. The Dark Knight | 2012 | Action | 448 | 164 |
Concept Involved:
There are various methods of collecting information by sampling. Once the information has been collected, the collection is called a data set. Variables can be divided into two types: qualitative and quantitative. Qualitative variables are also called categorical variable, classify individuals into categories. Quantitative variables are numerical and tell how much of something there is.
Qualitative variables come in two types: ordinal variables and nominal variables.
Ordinal variables are qualitative variables whose categories have a natural ordering.
Nominal variables are qualitative variables whose categories have no natural ordering.
Quantitative variables can be either discrete or continuous.
Discrete variables are those whose possible values can be listed. Often, discrete variables result from counting something, so the possible values of the variable are 0, 1, 2 and so forth.
Continuous variables can, in principle, take on any value within some interval.

The variable which classifies individuals into categories is called qualitative variable, and the variable which provide information about quantity or number of something is quantitative variable. The Tickets Sales (millions of $) and Running Time (minutes) represent how many of something of there is present.
Therefore, these columns represents quantitative variable.
c.
To identify:the columns that represent nominal variables.
Answer to Problem 48E
The columns Genre represent nominal variables.
Explanation of Solution
Given information:
| Movie Title | Release Year | Genre | Ticket Sales (millions of $) | Running Time (minutes) |
| 1. Star Wars Episode VII: The Force Awakens | 2015 | Adventure | 936 | 136 |
| 2. Avatars | 2009 | Action | 761 | 162 |
| 3. Titanic | 1997 | Historical Fiction | 659 | 194 |
| 4. Jurassic World | 2015 | Action | 652 | 124 |
| 5. The Avengers | 2012 | Adventure | 623 | 143 |
| 6. The Dark Knight | 2008 | Action | 533 | 152 |
| 7. Star Wars Episode I: The Phantom Menace | 1999 | Adventure | 475 | 133 |
| 8. Star Wars Episode IV: A New Hope | 1977 | Adventure | 461 | 119 |
| 9. Avengers: Age of Ultron | 2015 | Action | 459 | 141 |
| 10. The Dark Knight | 2012 | Action | 448 | 164 |
Concept Involved:
There are various methods of collecting information by sampling. Once the information has been collected, the collection is called a data set. Variables can be divided into two types: qualitative and quantitative. Qualitative variables are also called categorical variable, classify individuals into categories. Quantitative variables are numerical and tell how much of something there is.
Qualitative variables come in two types: ordinal variables and nominal variables.
Ordinal variables are qualitative variables whose categories have a natural ordering.
Nominal variables are qualitative variables whose categories have no natural ordering.
Quantitative variables can be either discrete or continuous.
Discrete variables are those whose possible values can be listed. Often, discrete variables result from counting something, so the possible values of the variable are 0, 1, 2 and so forth.
Continuous variables can, in principle, take on any value within some interval.

The values are classified into categories in a nominal variable, but no natural ordering is there in categories, whereas, the values are also classified into categories in an ordinary variable but a natural ordering is there in categories.
Therefore, the Genre column has categories but doesn’t have natural ordering.
d.
To identify:the columns that represent ordinal variables.
Answer to Problem 48E
The column Movie Title represent ordinal variables.
Explanation of Solution
Given information:
| Movie Title | Release Year | Genre | Ticket Sales (millions of $) | Running Time (minutes) |
| 1. Star Wars Episode VII: The Force Awakens | 2015 | Adventure | 936 | 136 |
| 2. Avatars | 2009 | Action | 761 | 162 |
| 3. Titanic | 1997 | Historical Fiction | 659 | 194 |
| 4. Jurassic World | 2015 | Action | 652 | 124 |
| 5. The Avengers | 2012 | Adventure | 623 | 143 |
| 6. The Dark Knight | 2008 | Action | 533 | 152 |
| 7. Star Wars Episode I: The Phantom Menace | 1999 | Adventure | 475 | 133 |
| 8. Star Wars Episode IV: A New Hope | 1977 | Adventure | 461 | 119 |
| 9. Avengers: Age of Ultron | 2015 | Action | 459 | 141 |
| 10. The Dark Knight | 2012 | Action | 448 | 164 |
Concept Involved:
There are various methods of collecting information by sampling. Once the information has been collected, the collection is called a data set. Variables can be divided into two types: qualitative and quantitative. Qualitative variables are also called categorical variable, classify individuals into categories. Quantitative variables are numerical and tell how much of something there is.
Qualitative variables come in two types: ordinal variables and nominal variables.
Ordinal variables are qualitative variables whose categories have a natural ordering.
Nominal variables are qualitative variables whose categories have no natural ordering.
Quantitative variables can be either discrete or continuous.
Discrete variables are those whose possible values can be listed. Often, discrete variables result from counting something, so the possible values of the variable are 0, 1, 2 and so forth.
Continuous variables can, in principle, take on any value within some interval.

The values are classified into categories in a nominal variable, but no natural ordering is there in categories, whereas, the values are also classified into categories in an ordinary variable but a natural ordering is there in categories. The variable movie title classifies the top grossing movies of all time.
Therefore, column Movie Title represents ordinal variables.
Want to see more full solutions like this?
Chapter 1 Solutions
Elementary Statistics


- Elementary StatsBase on the given data uploaded in module 4, change the variable sale price into two categories: abovethe mean price or not; and change the living area into two categories: above the median living area ornot ( your two group should have close number of houses in each group). Using the resulting variables,will you conclude that larger house corresponding to higher price?Note: Need computer output, Ho and Ha, P and decision. If p is small, you need to explain what type ofdependency (association) we have using an appropriate pair of percentages. Please include how to use the data in SPSS and interpretation of data.arrow_forwardAn environmental research team is studying the daily rainfall (in millimeters) in a region over 100 days. The data is grouped into the following histogram bins: Rainfall Range (mm) Frequency 0-9.9 15 10 19.9 25 20-29.9 30 30-39.9 20 ||40-49.9 10 a) If a random day is selected, what is the probability that the rainfall was at least 20 mm but less than 40 mm? b) Estimate the mean daily rainfall, assuming the rainfall in each bin is uniformly distributed and the midpoint of each bin represents the average rainfall for that range. c) Construct the cumulative frequency distribution and determine the rainfall level below which 75% of the days fall. d) Calculate the estimated variance and standard deviation of the daily rainfall based on the histogram data.arrow_forwardAn electronics company manufactures batches of n circuit boards. Before a batch is approved for shipment, m boards are randomly selected from the batch and tested. The batch is rejected if more than d boards in the sample are found to be faulty. a) A batch actually contains six faulty circuit boards. Find the probability that the batch is rejected when n = 20, m = 5, and d = 1. b) A batch actually contains nine faulty circuit boards. Find the probability that the batch is rejected when n = 30, m = 10, and d = 1.arrow_forward
- Twenty-eight applicants interested in working for the Food Stamp program took an examination designed to measure their aptitude for social work. A stem-and-leaf plot of the 28 scores appears below, where the first column is the count per branch, the second column is the stem value, and the remaining digits are the leaves. a) List all the values. Count 1 Stems Leaves 4 6 1 4 6 567 9 3688 026799 9 8 145667788 7 9 1234788 b) Calculate the first quartile (Q1) and the third Quartile (Q3). c) Calculate the interquartile range. d) Construct a boxplot for this data.arrow_forwardPam, Rob and Sam get a cake that is one-third chocolate, one-third vanilla, and one-third strawberry as shown below. They wish to fairly divide the cake using the lone chooser method. Pam likes strawberry twice as much as chocolate or vanilla. Rob only likes chocolate. Sam, the chooser, likes vanilla and strawberry twice as much as chocolate. In the first division, Pam cuts the strawberry piece off and lets Rob choose his favorite piece. Based on that, Rob chooses the chocolate and vanilla parts. Note: All cuts made to the cake shown below are vertical.Which is a second division that Rob would make of his share of the cake?arrow_forwardThree players (one divider and two choosers) are going to divide a cake fairly using the lone divider method. The divider cuts the cake into three slices (s1, s2, and s3). If the choosers' declarations are Chooser 1: {s1 , s2} and Chooser 2: {s2 , s3}. Using the lone-divider method, how many different fair divisions of this cake are possible?arrow_forward
- Theorem 2.6 (The Minkowski inequality) Let p≥1. Suppose that X and Y are random variables, such that E|X|P <∞ and E|Y P <00. Then X+YpX+Yparrow_forwardTheorem 1.2 (1) Suppose that P(|X|≤b) = 1 for some b > 0, that EX = 0, and set Var X = 0². Then, for 0 0, P(X > x) ≤e-x+1²² P(|X|>x) ≤2e-1x+1²² (ii) Let X1, X2...., Xn be independent random variables with mean 0, suppose that P(X ≤b) = 1 for all k, and set oσ = Var X. Then, for x > 0. and 0x) ≤2 exp Σ k=1 (iii) If, in addition, X1, X2, X, are identically distributed, then P(S|x) ≤2 expl-tx+nt²o).arrow_forwardTheorem 5.1 (Jensen's inequality) state without proof the Jensen's Ineg. Let X be a random variable, g a convex function, and suppose that X and g(X) are integrable. Then g(EX) < Eg(X).arrow_forward
- Can social media mistakes hurt your chances of finding a job? According to a survey of 1,000 hiring managers across many different industries, 76% claim that they use social media sites to research prospective candidates for any job. Calculate the probabilities of the following events. (Round your answers to three decimal places.) answer parts a-c. a) Out of 30 job listings, at least 19 will conduct social media screening. b) Out of 30 job listings, fewer than 17 will conduct social media screening. c) Out of 30 job listings, exactly between 19 and 22 (including 19 and 22) will conduct social media screening. show all steps for probabilities please. answer parts a-c.arrow_forwardQuestion: we know that for rt. (x+ys s ا. 13. rs. and my so using this, show that it vye and EIXI, EIYO This : E (IX + Y) ≤2" (EIX (" + Ely!")arrow_forwardTheorem 2.4 (The Hölder inequality) Let p+q=1. If E|X|P < ∞ and E|Y| < ∞, then . |EXY ≤ E|XY|||X|| ||||qarrow_forward
 Holt Mcdougal Larson Pre-algebra: Student Edition...AlgebraISBN:9780547587776Author:HOLT MCDOUGALPublisher:HOLT MCDOUGAL
 Glencoe Algebra 1, Student Edition, 9780079039897...AlgebraISBN:9780079039897Author:CarterPublisher:McGraw Hill
 Functions and Change: A Modeling Approach to Coll...AlgebraISBN:9781337111348Author:Bruce Crauder, Benny Evans, Alan NoellPublisher:Cengage Learning
 Big Ideas Math A Bridge To Success Algebra 1: Stu...AlgebraISBN:9781680331141Author:HOUGHTON MIFFLIN HARCOURTPublisher:Houghton Mifflin Harcourt
 Algebra and Trigonometry (MindTap Course List)AlgebraISBN:9781305071742Author:James Stewart, Lothar Redlin, Saleem WatsonPublisher:Cengage Learning
 College AlgebraAlgebraISBN:9781305115545Author:James Stewart, Lothar Redlin, Saleem WatsonPublisher:Cengage Learning