Concept explainers
Videos
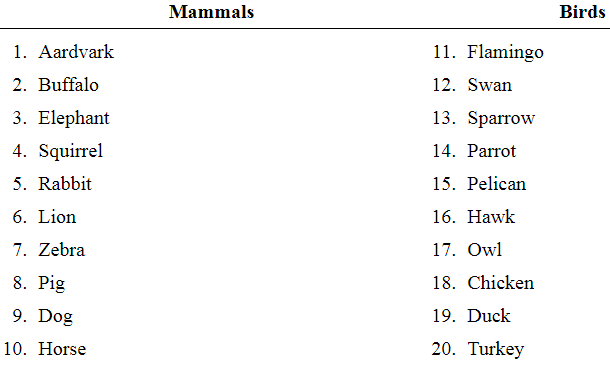
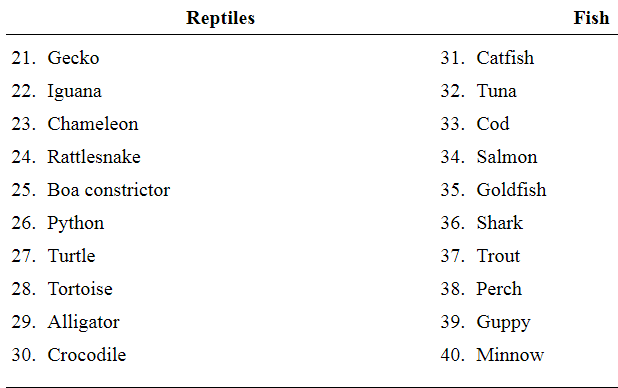
Exercises 21—24 refer to the population of animals in the following table. The population is divided into four groups: mammals, birds, reptiles, and fish.
Another sample: Draw a simple random sample of two groups of animals from the four groups, and construct a sample of 20 animals by including all the animals in the sampled groups. What kind of sample is this?
Tofind:The simple random sample of two groups of animal and the type of sample.
Answer to Problem 23E
The simple random sample of two groups of animal is
Explanation of Solution
Given information:The population is divided into four groups: mammals, birds, reptiles, and fish. Refer to the population of animals in the following table.
| Mammals | Birds | Reptiles | Fish |
| Aardvark Buffalo Elephant Squirrel Rabbit Lion Zebra Pig Dog Horse | 11. Flamingo 12. Swan 13. Sparrow 14. Parrot 15. Pelican 16. Hawk 17. Owl 18. Chicken 19. Duck 20. Turkey | 21. Gecko 22. Iguana 23. Chameleon 24. Rattlesnake 25. Boa constrictor 26. Python 27. Turtle 28. Tortoise 29. Alligator 30. Crocodile | 31. Catfish 32. Tuna 33. Cod 34. Salmon 35. Goldfish 36. Shark 37. Trout 38. Perch 39. Guppy 40. Minnow |
Concept Involved:
If a sample is taken from a population and each item is equally like to make the sample then the sample is called simple random sample.
Calculation:
Since, the items are drawn from the population in groups, or clusters.
Thus, the type of sample is cluster sample.
Consider a simple random sample of two groups of animals from the four groups, and construct a sample of 20 animals by including all the animals in the sampled groups.
| Group | Samples | |
| Mammals | 1 | Aardvark, Buffalo, Elephant, Squirrel, Rabbit, Lion, Zebra, Pig, Dog, Horse |
| Birds | 2 | Flamingo, Swan, Sparrow, Parrot, Pelican, Hawk, Owl, Chicken, Duck, Turkey |
| Reptiles | 3 | Gecko, Iguana, Chameleon, Rattlesnake, Boa constrictor, Python, Turtle, Tortoise, Alligator, Crocodile |
| Fish | 4 | Catfish, Tuna, Cod, Salmon, Goldfish, Shark, Trout, Perch, Guppy, Minnow |
The step-by-step procedure is shown below.
Step 1: Enter any nonzero number on the HOME screen as the seed Step 2: Press Step 3: Press Step 4: Press Then enter Step 5: Press |
Therefore, the simple random sample of two groups of animal is
Want to see more full solutions like this?
Chapter 1 Solutions
Elementary Statistics
Additional Math Textbook Solutions
Pathways To Math Literacy (looseleaf)
Precalculus: Mathematics for Calculus (Standalone Book)
Elementary and Intermediate Algebra: Concepts and Applications (7th Edition)
Graphical Approach To College Algebra
Calculus for Business, Economics, Life Sciences, and Social Sciences (14th Edition)
Probability And Statistical Inference (10th Edition)


- You want to compare the average number of tines on the antlers of male deer in two nearby metro parks. A sample of 30 deer from the first park shows an average of 5 tines with a population standard deviation of 3. A sample of 35 deer from the second park shows an average of 6 tines with a population standard deviation of 3.2. Find a 95 percent confidence interval for the difference in average number of tines for all male deer in the two metro parks (second park minus first park).Do the parks’ deer populations differ in average size of deer antlers?arrow_forwardSuppose that you want to increase the confidence level of a particular confidence interval from 80 percent to 95 percent without changing the width of the confidence interval. Can you do it?arrow_forwardA random sample of 1,117 U.S. college students finds that 729 go home at least once each term. Find a 98 percent confidence interval for the proportion of all U.S. college students who go home at least once each term.arrow_forward
- Suppose that you make two confidence intervals with the same data set — one with a 95 percent confidence level and the other with a 99.7 percent confidence level. Which interval is wider?Is a wide confidence interval a good thing?arrow_forwardIs it true that a 95 percent confidence interval means you’re 95 percent confident that the sample statistic is in the interval?arrow_forwardTines can range from 2 to upwards of 50 or more on a male deer. You want to estimate the average number of tines on the antlers of male deer in a nearby metro park. A sample of 30 deer has an average of 5 tines, with a population standard deviation of 3. Find a 95 percent confidence interval for the average number of tines for all male deer in this metro park.Find a 98 percent confidence interval for the average number of tines for all male deer in this metro park.arrow_forward
- Based on a sample of 100 participants, the average weight loss the first month under a new (competing) weight-loss plan is 11.4 pounds with a population standard deviation of 5.1 pounds. The average weight loss for the first month for 100 people on the old (standard) weight-loss plan is 12.8 pounds, with population standard deviation of 4.8 pounds. Find a 90 percent confidence interval for the difference in weight loss for the two plans( old minus new) Whats the margin of error for your calculated confidence interval?arrow_forwardA 95 percent confidence interval for the average miles per gallon for all cars of a certain type is 32.1, plus or minus 1.8. The interval is based on a sample of 40 randomly selected cars. What units represent the margin of error?Suppose that you want to decrease the margin of error, but you want to keep 95 percent confidence. What should you do?arrow_forward3. (i) Below is the R code for performing a X2 test on a 2×3 matrix of categorical variables called TestMatrix: chisq.test(Test Matrix) (a) Assuming we have a significant result for this procedure, provide the R code (including any required packages) for an appropriate post hoc test. (b) If we were to apply this technique to a 2 × 2 case, how would we adapt the code in order to perform the correct test? (ii) What procedure can we use if we want to test for association when we have ordinal variables? What code do we use in R to do this? What package does this command belong to? (iii) The following code contains the initial steps for a scenario where we are looking to investigate the relationship between age and whether someone owns a car by using frequencies. There are two issues with the code - please state these. Row3<-c(75,15) Row4<-c(50,-10) MortgageMatrix<-matrix(c(Row1, Row4), byrow=T, nrow=2, MortgageMatrix dimnames=list(c("Yes", "No"), c("40 or older","<40")))…arrow_forward
- Describe the situation in which Fisher’s exact test would be used?(ii) When do we use Yates’ continuity correction (with respect to contingencytables)?[2 Marks] 2. Investigate, checking the relevant assumptions, whether there is an associationbetween age group and home ownership based on the sample dataset for atown below:Home Owner: Yes NoUnder 40 39 12140 and over 181 59Calculate and evaluate the effect size.arrow_forwardNot use ai pleasearrow_forwardNeed help with the following statistic problems.arrow_forward
 Holt Mcdougal Larson Pre-algebra: Student Edition...AlgebraISBN:9780547587776Author:HOLT MCDOUGALPublisher:HOLT MCDOUGAL
 Glencoe Algebra 1, Student Edition, 9780079039897...AlgebraISBN:9780079039897Author:CarterPublisher:McGraw Hill
 Big Ideas Math A Bridge To Success Algebra 1: Stu...AlgebraISBN:9781680331141Author:HOUGHTON MIFFLIN HARCOURTPublisher:Houghton Mifflin Harcourt
 College Algebra (MindTap Course List)AlgebraISBN:9781305652231Author:R. David Gustafson, Jeff HughesPublisher:Cengage Learning