
Concept Introduction:
Fixed Cost: This refers to the constant cost which does not vary as the quantity produced of a good or service changes. It remains the same at any level of production.
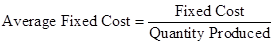
Average Fixed Cost: This refers to the fixed cost per unit at a particular level of production. It shall be calculated as follows:
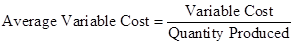
Variable Cost: This refers to the cost which is not fixed and varies as the quantity of a good or service produced changes.
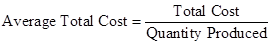
Total Cost: This refers to the entire cost incurred in the production of goods or services, whether fixed or variable. It shall be calculated as follows:

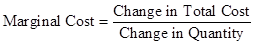
Marginal Cost: This refers to the change in the cost which is incurred when an additional unit of any good or service is produced. It shall be calculated as follows:
Want to see the full answer?
Check out a sample textbook solution

- Not use ai please letarrow_forwardConsider the market for sweaters in a Hamilton neighbourhood shown in the figure to the right. The consumer surplus generated by consuming the 29th sweater is OA. $67.90. OB. $58.20. ○ C. $77.60. OD. $38.80. ○ E. $19.50. Price ($) 97 68.0 48.5 29.0 29.0 Sweater Market 48.5 Quantity (Sweaters per week)arrow_forwardNot use ai pleasearrow_forward
- In the following table, complete the third column by determining the quantity sold in each country at a price of $18 per toy train. Next, complete the fourth column by calculating the total profit and the profit from each country under a single price. Price Single Price Quantity Sold Price Discrimination Country (Dollars per toy train) (Millions of toy trains) Profit (Millions of dollars) Price (Dollars per toy train) Quantity Sold (Millions of toy trains) Profit (Millions of dollars) France 18 Russia 18 Total N/A N/A N/A N/A Suppose that as a profit-maximizing firm, Le Jouet decides to price discriminate by charging a different price in each market, while its marginal cost of production remains $8 per toy. Complete the last three columns in the previous table by determining the profit-maximizing price, the quantity sold at that price, the profit in each country, and total profit if Le Jouet price discriminates. Le Jouet charges a lower price in the market with a relatively elastic…arrow_forwardNot use ai pleasearrow_forwardNot dhdjdjdjduudnxnxjfjfi feverarrow_forward
- Discuss the different types of resources (natural, human, capital) and how they are allocated in an economy. Identify which resources are scarce and which are abundant, and explain the implications of this scarcity or abundance.arrow_forwardNot use ai pleasearrow_forwardNot use ai please letarrow_forward
- Location should be in GWAGWALADA Abuja Nigeria Use the Internet to do itarrow_forwardUsing data from 1988 for houses sold in Andover, Massachusetts, from Kiel and McClain (1995), the following equation relates housing price (price) to the distance from a recently built garbage incinerator (dist): = log(price) 9.40 + 0.312 log(dist) n = 135, R2 = 0.162. Interpretation of the slope coefficient? ► How would our interpretation of the slope coefficient change if distance were measured in metres instead of kilometres?arrow_forwardIf GDP goes up by 1% and the investment component of GDPgoes up by more than 1%, how is the investment share ofGDP changing in absolute terms?▶ In economics, what else is expressed as relative percentagechanges?arrow_forward

 Principles of Economics (12th Edition)EconomicsISBN:9780134078779Author:Karl E. Case, Ray C. Fair, Sharon E. OsterPublisher:PEARSON
 Engineering Economy (17th Edition)EconomicsISBN:9780134870069Author:William G. Sullivan, Elin M. Wicks, C. Patrick KoellingPublisher:PEARSON
 Principles of Economics (MindTap Course List)EconomicsISBN:9781305585126Author:N. Gregory MankiwPublisher:Cengage Learning
 Managerial Economics: A Problem Solving ApproachEconomicsISBN:9781337106665Author:Luke M. Froeb, Brian T. McCann, Michael R. Ward, Mike ShorPublisher:Cengage Learning
 Managerial Economics & Business Strategy (Mcgraw-...EconomicsISBN:9781259290619Author:Michael Baye, Jeff PrincePublisher:McGraw-Hill Education