
The Practice of Statistics for AP - 4th Edition
4th Edition
ISBN: 9781429245593
Author: Starnes, Daren S., Yates, Daniel S., Moore, David S.
Publisher: Macmillan Higher Education
expand_more
expand_more
format_list_bulleted
Concept explainers
Videos
Question
Chapter 12, Problem 28PT4
To determine
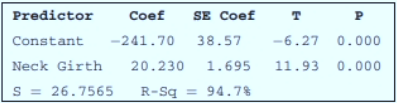
To find the correct 95% confidence interval for the slope of the regression line.
Expert Solution & Answer
Answer to Problem 28PT4
Explanation of Solution
Given:
Formula:
Confidence interval for slope is,
The confidence level = 0.95
So, level of significance =
First need to find critical t value.
tc = 2.306 …Using excel formula, =TINV(0.05,8)
Using formula, 95% confidence interval for the slope of the regression line.
Chapter 12 Solutions
The Practice of Statistics for AP - 4th Edition
Ch. 12.1 - Prob. 1.1CYUCh. 12.1 - Prob. 1.2CYUCh. 12.1 - Prob. 2.1CYUCh. 12.1 - Prob. 2.2CYUCh. 12.1 - Prob. 1ECh. 12.1 - Prob. 2ECh. 12.1 - Prob. 3ECh. 12.1 - Prob. 4ECh. 12.1 - Prob. 5ECh. 12.1 - Prob. 6E
Ch. 12.1 - Prob. 7ECh. 12.1 - Prob. 8ECh. 12.1 - Prob. 9ECh. 12.1 - Prob. 10ECh. 12.1 - Prob. 11ECh. 12.1 - Prob. 12ECh. 12.1 - Prob. 13ECh. 12.1 - Prob. 14ECh. 12.1 - Prob. 15ECh. 12.1 - Prob. 16ECh. 12.1 - Prob. 17ECh. 12.1 - Prob. 18ECh. 12.1 - Prob. 19ECh. 12.1 - Prob. 20ECh. 12.1 - Prob. 21ECh. 12.1 - Prob. 22ECh. 12.1 - Prob. 23ECh. 12.1 - Prob. 24ECh. 12.1 - Prob. 25ECh. 12.1 - Prob. 26ECh. 12.1 - Prob. 27ECh. 12.1 - Prob. 28ECh. 12.1 - Prob. 29ECh. 12.1 - Prob. 30ECh. 12.1 - Prob. 31ECh. 12.1 - Prob. 32ECh. 12.2 - Prob. 1.1CYUCh. 12.2 - Prob. 1.2CYUCh. 12.2 - Prob. 1.3CYUCh. 12.2 - Prob. 1.4CYUCh. 12.2 - Prob. 33ECh. 12.2 - Prob. 34ECh. 12.2 - Prob. 35ECh. 12.2 - Prob. 36ECh. 12.2 - Prob. 37ECh. 12.2 - Prob. 38ECh. 12.2 - Prob. 39ECh. 12.2 - Prob. 40ECh. 12.2 - Prob. 41ECh. 12.2 - Prob. 42ECh. 12.2 - Prob. 43ECh. 12.2 - Prob. 44ECh. 12.2 - Prob. 45ECh. 12.2 - Prob. 46ECh. 12.2 - Prob. 47ECh. 12.2 - Prob. 48ECh. 12.2 - Prob. 49ECh. 12.2 - Prob. 50ECh. 12.2 - Prob. 51ECh. 12.2 - Prob. 52ECh. 12 - Prob. 1CRECh. 12 - Prob. 2CRECh. 12 - Prob. 3CRECh. 12 - Prob. 4CRECh. 12 - Prob. 5CRECh. 12 - Prob. 6CRECh. 12 - Prob. 1PTCh. 12 - Prob. 2PTCh. 12 - Prob. 3PTCh. 12 - Prob. 4PTCh. 12 - Prob. 5PTCh. 12 - Prob. 6PTCh. 12 - Prob. 7PTCh. 12 - Prob. 8PTCh. 12 - Prob. 9PTCh. 12 - Prob. 10PTCh. 12 - Prob. 11PTCh. 12 - Prob. 12PTCh. 12 - Prob. 1PT4Ch. 12 - Prob. 2PT4Ch. 12 - Prob. 3PT4Ch. 12 - Prob. 4PT4Ch. 12 - Prob. 5PT4Ch. 12 - Prob. 6PT4Ch. 12 - Prob. 7PT4Ch. 12 - Prob. 8PT4Ch. 12 - Prob. 9PT4Ch. 12 - Prob. 10PT4Ch. 12 - Prob. 11PT4Ch. 12 - Prob. 12PT4Ch. 12 - Prob. 13PT4Ch. 12 - Prob. 14PT4Ch. 12 - Prob. 15PT4Ch. 12 - Prob. 16PT4Ch. 12 - Prob. 17PT4Ch. 12 - Prob. 18PT4Ch. 12 - Prob. 19PT4Ch. 12 - Prob. 20PT4Ch. 12 - Prob. 21PT4Ch. 12 - Prob. 22PT4Ch. 12 - Prob. 23PT4Ch. 12 - Prob. 24PT4Ch. 12 - Prob. 25PT4Ch. 12 - Prob. 26PT4Ch. 12 - Prob. 27PT4Ch. 12 - Prob. 28PT4Ch. 12 - Prob. 29PT4Ch. 12 - Prob. 30PT4Ch. 12 - Prob. 31PT4Ch. 12 - Prob. 32PT4Ch. 12 - Prob. 33PT4Ch. 12 - Prob. 34PT4Ch. 12 - Prob. 35PT4Ch. 12 - Prob. 36PT4Ch. 12 - Prob. 37PT4Ch. 12 - Prob. 38PT4Ch. 12 - Prob. 39PT4Ch. 12 - Prob. 40PT4Ch. 12 - Prob. 41PT4Ch. 12 - Prob. 42PT4Ch. 12 - Prob. 43PT4Ch. 12 - Prob. 44PT4Ch. 12 - Prob. 45PT4Ch. 12 - Prob. 46PT4
Additional Math Textbook Solutions
Find more solutions based on key concepts
Consider a group of 20 people. If everyone shakes hands with everyone else, how many handshakes take place?
A First Course in Probability (10th Edition)
Mathematical Connections Explain why a number and a numeral are considered different.
A Problem Solving Approach To Mathematics For Elementary School Teachers (13th Edition)
Solve the inequality 3x27 .
Precalculus
In hypothesis testing, the common level of significance is =0.05. Some might argue for a level of significance ...
Basic Business Statistics, Student Value Edition
Boxplots. In Exercises 29-32, use the given data to construct a boxplot and identify the 5-number summary.
32. ...
Elementary Statistics (13th Edition)
CHECK POINT I Express as a percent.
Thinking Mathematically (6th Edition)
Knowledge Booster


Learn more about
Need a deep-dive on the concept behind this application? Look no further. Learn more about this topic, statistics and related others by exploring similar questions and additional content below.Similar questions
- 1 for all k, and set o (ii) Let X1, X2, that P(Xkb) = x > 0. Xn be independent random variables with mean 0, suppose = and Var Xk. Then, for 0x) ≤2 exp-tx+121 Στ k=1arrow_forwardLemma 1.1 Suppose that g is a non-negative, non-decreasing function such that E g(X) 0. Then, E g(|X|) P(|X|> x) ≤ g(x)arrow_forwardProof of this Theorem Theorem 1.2 (i) Suppose that P(|X| ≤ b) = 1 for some b > 0, that E X = 0, and set Var X = o². Then, for 0 0, P(X > x) ≤ e−1x+1²², P(|X|> x) ≤ 2e−x+1² 0²arrow_forward
- State and prove the Morton's inequality Theorem 1.1 (Markov's inequality) Suppose that E|X|" 0, and let x > 0. Then, E|X|" P(|X|> x) ≤ x"arrow_forward(iii) If, in addition, X1, X2, ... Xn are identically distributed, then P(S|>x) ≤2 exp{-tx+nt²o}}.arrow_forward5. State space models Consider the model T₁ = Tt−1 + €t S₁ = 0.8S-4+ Nt Y₁ = T₁ + S₁ + V₂ where (+) Y₁,..., Y. ~ WN(0,σ²), nt ~ WN(0,σ2), and (V) ~ WN(0,0). We observe data a. Write the model in the standard (matrix) form of a linear Gaussian state space model. b. Does lim+++∞ Var (St - St|n) exist? If so, what is its value? c. Does lim∞ Var(T₁ — Ît\n) exist? If so, what is its value?arrow_forward
- Let X represent the full height of a certain species of tree. Assume that X has a normal probability distribution with mean 203.8 ft and standard deviation 43.8 ft. You intend to measure a random sample of n = 211trees. The bell curve below represents the distribution of these sample means. The scale on the horizontal axis (each tick mark) is one standard error of the sampling distribution. Complete the indicated boxes, correct to two decimal places. Image attached. I filled in the yellow boxes and am not sure why they are wrong. There are 3 yellow boxes filled in with values 206.82; 209.84; 212.86.arrow_forwardCould you please answer this question using excel.Thanksarrow_forwardQuestions An insurance company's cumulative incurred claims for the last 5 accident years are given in the following table: Development Year Accident Year 0 2018 1 2 3 4 245 267 274 289 292 2019 255 276 288 294 2020 265 283 292 2021 263 278 2022 271 It can be assumed that claims are fully run off after 4 years. The premiums received for each year are: Accident Year Premium 2018 306 2019 312 2020 318 2021 326 2022 330 You do not need to make any allowance for inflation. 1. (a) Calculate the reserve at the end of 2022 using the basic chain ladder method. (b) Calculate the reserve at the end of 2022 using the Bornhuetter-Ferguson method. 2. Comment on the differences in the reserves produced by the methods in Part 1.arrow_forward
- Calculate the correlation coefficient r, letting Row 1 represent the x-values and Row 2 the y-values. Then calculate it again, letting Row 2 represent the x-values and Row 1 the y-values. What effect does switching the variables have on r? Row 1 Row 2 13 149 25 36 41 60 62 78 S 205 122 195 173 133 197 24 Calculate the correlation coefficient r, letting Row 1 represent the x-values and Row 2 the y-values. r=0.164 (Round to three decimal places as needed.) S 24arrow_forwardThe number of initial public offerings of stock issued in a 10-year period and the total proceeds of these offerings (in millions) are shown in the table. The equation of the regression line is y = 47.109x+18,628.54. Complete parts a and b. 455 679 499 496 378 68 157 58 200 17,942|29,215 43,338 30,221 67,266 67,461 22,066 11,190 30,707| 27,569 Issues, x Proceeds, 421 y (a) Find the coefficient of determination and interpret the result. (Round to three decimal places as needed.)arrow_forwardQuestions An insurance company's cumulative incurred claims for the last 5 accident years are given in the following table: Development Year Accident Year 0 2018 1 2 3 4 245 267 274 289 292 2019 255 276 288 294 2020 265 283 292 2021 263 278 2022 271 It can be assumed that claims are fully run off after 4 years. The premiums received for each year are: Accident Year Premium 2018 306 2019 312 2020 318 2021 326 2022 330 You do not need to make any allowance for inflation. 1. (a) Calculate the reserve at the end of 2022 using the basic chain ladder method. (b) Calculate the reserve at the end of 2022 using the Bornhuetter-Ferguson method. 2. Comment on the differences in the reserves produced by the methods in Part 1.arrow_forward
arrow_back_ios
SEE MORE QUESTIONS
arrow_forward_ios
Recommended textbooks for you
 MATLAB: An Introduction with ApplicationsStatisticsISBN:9781119256830Author:Amos GilatPublisher:John Wiley & Sons Inc
 Probability and Statistics for Engineering and th...StatisticsISBN:9781305251809Author:Jay L. DevorePublisher:Cengage Learning
 Statistics for The Behavioral Sciences (MindTap C...StatisticsISBN:9781305504912Author:Frederick J Gravetter, Larry B. WallnauPublisher:Cengage Learning
 Elementary Statistics: Picturing the World (7th E...StatisticsISBN:9780134683416Author:Ron Larson, Betsy FarberPublisher:PEARSON
 The Basic Practice of StatisticsStatisticsISBN:9781319042578Author:David S. Moore, William I. Notz, Michael A. FlignerPublisher:W. H. Freeman
 Introduction to the Practice of StatisticsStatisticsISBN:9781319013387Author:David S. Moore, George P. McCabe, Bruce A. CraigPublisher:W. H. Freeman
MATLAB: An Introduction with Applications
Statistics
ISBN:9781119256830
Author:Amos Gilat
Publisher:John Wiley & Sons Inc
Probability and Statistics for Engineering and th...
Statistics
ISBN:9781305251809
Author:Jay L. Devore
Publisher:Cengage Learning
Statistics for The Behavioral Sciences (MindTap C...
Statistics
ISBN:9781305504912
Author:Frederick J Gravetter, Larry B. Wallnau
Publisher:Cengage Learning
Elementary Statistics: Picturing the World (7th E...
Statistics
ISBN:9780134683416
Author:Ron Larson, Betsy Farber
Publisher:PEARSON
The Basic Practice of Statistics
Statistics
ISBN:9781319042578
Author:David S. Moore, William I. Notz, Michael A. Fligner
Publisher:W. H. Freeman
Introduction to the Practice of Statistics
Statistics
ISBN:9781319013387
Author:David S. Moore, George P. McCabe, Bruce A. Craig
Publisher:W. H. Freeman
Correlation Vs Regression: Difference Between them with definition & Comparison Chart; Author: Key Differences;https://www.youtube.com/watch?v=Ou2QGSJVd0U;License: Standard YouTube License, CC-BY
Correlation and Regression: Concepts with Illustrative examples; Author: LEARN & APPLY : Lean and Six Sigma;https://www.youtube.com/watch?v=xTpHD5WLuoA;License: Standard YouTube License, CC-BY