Videos
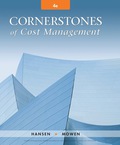
Joseph Fox, controller of Thorpe Company, has been in charge of a project to install an activity-based cost management system. This new system is designed to support the company’s efforts to become more competitive. For the past six weeks, he and the project committee members have been identifying and defining activities, associating workers with activities, and assessing the time and resources consumed by individual activities. Now, he and the project committee are focusing on three additional implementation issues: (1) identifying activity drivers, (2) assessing value content, and (3) identifying cost drivers (root causes). Joseph has assigned a committee member the responsibilities of assessing the value content of five activities, choosing a suitable activity driver for each activity, and identifying the possible root causes of the activities. Following are the five activities with possible activity drivers:
The committee member ran a regression analysis for each potential activity driver, using the method of least squares to estimate the variable and fixed cost components. In all five cases, costs were highly correlated with the potential drivers. Thus, all drivers appeared to be good candidates for assigning costs to products. The company plans to reward production managers for reducing product costs.
Required:
- 1. What is the difference between an activity driver and a cost driver? In answering the question, describe the purpose of each type of driver.
- 2. For each activity, assess the value content and classify each activity as value-added or non-value-added (justify the classification). Identify some possible root causes of each activity, and describe how this knowledge can be used to improve activity performance. For purposes of discussion, assume that the value-added activities are not performed with perfect efficiency.
- 3. Describe the behavior that each activity driver will encourage, and evaluate the suitability of that behavior for the company’s objective of becoming more competitive.

Trending nowThis is a popular solution!

Chapter 12 Solutions
EBK CORNERSTONES OF COST MANAGEMENT


- Mit Distributors provided the following inventory-related data for the fiscal year: Purchases: $385,000 Purchase Returns and Allowances: $10,200 Purchase Discounts: $4,300 Freight In: $55,000 Beginning Inventory: $72,000 Ending Inventory: $95,500 What is the Cost of Goods Sold (COGS)?arrow_forwardanswer ? general accountingarrow_forwardBrightTech Corp. reported the following cost of goods sold (COGS) figures over three years: • 2023: $3,800,000 • 2022: $3,500,000 • 2021: $3,000,000 If 2021 is the base year, what is the percentage increase in COGS from 2021 to 2023?arrow_forward
- Sun Electronics operates a periodic inventory system. At the beginning of 2022, its inventory was $95,750. During the year, inventory purchases totaled $375,000, and its ending inventory was $110,500. What was the cost of goods sold (COGS) for Sun Electronics in 2022?arrow_forwardi want to this question answer of this general accountingarrow_forwardA clothing retailer provides the following financial data for the year. Determine the cost of goods sold (COGS): ⚫Total Sales: $800,000 • Purchases: $500,000 • Sales Returns: $30,000 • Purchases Returns: $40,000 • Opening Stock Value: $60,000 • Closing Stock Value: $70,000 Administrative Expenses: $250,000arrow_forward
- subject : general accounting questionarrow_forwardBrightTech Inc. had stockholders' equity of $1,200,000 at the beginning of June 2023. During the month, the company reported a net income of $300,000 and declared dividends of $175,000. What was BrightTech Inc.. s stockholders' equity at the end of June 2023?arrow_forwardQuestion 3Footfall Manufacturing Ltd. reports the following financialinformation at the end of the current year: Net Sales $100,000 Debtor's turnover ratio (based on net sales) 2 Inventory turnover ratio 1.25 fixed assets turnover ratio 0.8 Debt to assets ratio 0.6 Net profit margin 5% gross profit margin 25% return on investments 2% Use the given information to fill out the templates for incomestatement and balance sheet given below: Income Statement of Footfall Manufacturing Ltd. for the year endingDecember 31, 20XX(in $) Sales 100,000 Cost of goods sold gross profit other expenses earnings before tax tax @ 50% Earnings after tax Balance Sheet of Footfall Manufacturing Ltd. as at December 31, 20XX(in $) Liabilities Amount Assets Amount Equity Net fixed assets long term debt 50,000 Inventory short term debt debtors cash Total Totalarrow_forward
 Cornerstones of Cost Management (Cornerstones Ser...AccountingISBN:9781305970663Author:Don R. Hansen, Maryanne M. MowenPublisher:Cengage Learning
 Managerial Accounting: The Cornerstone of Busines...AccountingISBN:9781337115773Author:Maryanne M. Mowen, Don R. Hansen, Dan L. HeitgerPublisher:Cengage Learning
 Managerial AccountingAccountingISBN:9781337912020Author:Carl Warren, Ph.d. Cma William B. TaylerPublisher:South-Western College Pub