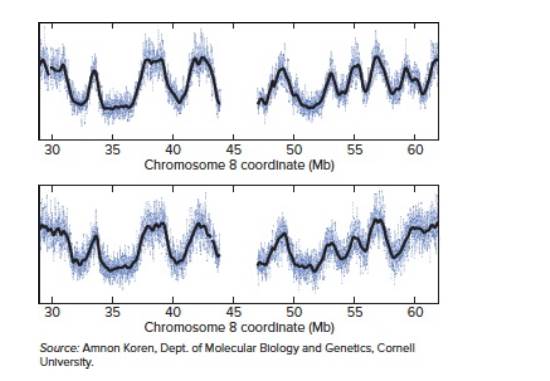
In an experiment published in the journal Cell in 2014, Amnon Koren and Steven McCarroll isolated two populations of growing tissue culture cells from each of two unrelated people from different parts of the world.
One population from each person consisted of millions of cells that were in G of the cell cycle; the other population was a similar number of cells that were in S phase for various amounts of time. The scientists then performed high-throughput DNA sequencing on these cell populations.
The two graphs that follow show the data for the two individuals. In each graph, the x-axis represents positions along a chromosome (here, chromosome 8), and the y-axis represents the ratio between the number of reads obtained for a given region of the genome from the S phase sample divided by the number of reads obtained for the same region from the G sample. Each small purple dot is 2 kb along the chromosome; the black line is the moving average of the purple.

| a. | At chromosomal coordinate 33 Mb, the y-axis value is much higher than at coordinate 35 Mb. What does this fact tell you about the timing of |
| b. | Scientists still do not have a good idea about the nature of DNA sequences or chromatin structures that define origins of replication in human cells. If you were trying to locate such origins of replication, where would you look? |
| c. | Suppose you did a similar experiment using two populations with the same number of cells, one population in G and the other in G . If you graphed the data in a similar fashion, with the y-axis representing the ratio of the number of reads from the G sample divided by the number of reads from the G sample, what would the plot look like? |
| d. | The patterns for these two people are very nearly the same, even though they are completely unrelated. What does this fact suggest? |
| e. | These scientists later reasoned that they could obtain the same kind of information from any person whose genome had been sequenced by high-throughput methods, without separating out populations of cells at different cell cycle stages. What would have to be true about the cells analyzed and the kinds of data available? Why would you want to look at this data from many different people? |
Want to see the full answer?
Check out a sample textbook solution
Chapter 12 Solutions
GENETICS(LL)-W/CONNECT >CUSTOM<
- A negligence action was brought by a mother against a hospital on behalf of her minor daughter. It alleged that when the mother was 13 years of age, the hospital negligently transfused her with Rh-positive blood. The mother's Rh-negative blood was incompatible with and sensitized by the Rh-positive blood. The mother discovered her condition 8 years later during a routine blood screening ordered by her healthcare provider in the course of prenatal care. The resulting sensitization of the mother's blood allegedly caused damage to the fetus, resulting in physical defects and premature birth. Did a patient relationship with the transfusing hospital exist?arrow_forward18. Watch this short youtube video about SARS CoV-2 replication. SARS-CoV-2 Life Cycle (Summer 2020) - YouTube.19. What is the name of the receptor that SARS CoV-2 uses to enter cells? Which human cells express this receptor? 20. Name a few of the proteins that the SARS CoV-2 mRNA codes for. 21. What is the role of the golgi apparatus related to SARS CoV-2arrow_forwardState the five functions of Globular Proteins, and give an example of a protein for each function.arrow_forward
- Diagram of check cell under low power and high powerarrow_forwarda couple in which the father has the a blood type and the mother has the o blood type produce an offspring with the o blood type, how does this happen? how could two functionally O parents produce an offspring that has the a blood type?arrow_forwardWhat is the opening indicated by the pointer? (leaf x.s.) stomate guard cell lenticel intercellular space none of thesearrow_forward
- Identify the indicated tissue? (stem x.s.) parenchyma collenchyma sclerenchyma ○ xylem ○ phloem none of thesearrow_forwardWhere did this structure originate from? (Salix branch root) epidermis cortex endodermis pericycle vascular cylinderarrow_forwardIdentify the indicated tissue. (Tilia stem x.s.) parenchyma collenchyma sclerenchyma xylem phloem none of thesearrow_forward
- Identify the indicated structure. (Cucurbita stem l.s.) pit lenticel stomate tendril none of thesearrow_forwardIdentify the specific cell? (Zebrina leaf peel) vessel element sieve element companion cell tracheid guard cell subsidiary cell none of thesearrow_forwardWhat type of cells flank the opening on either side? (leaf x.s.) vessel elements sieve elements companion cells tracheids guard cells none of thesearrow_forward
 Biology: The Dynamic Science (MindTap Course List)BiologyISBN:9781305389892Author:Peter J. Russell, Paul E. Hertz, Beverly McMillanPublisher:Cengage Learning
 Human Heredity: Principles and Issues (MindTap Co...BiologyISBN:9781305251052Author:Michael CummingsPublisher:Cengage Learning
 Biology 2eBiologyISBN:9781947172517Author:Matthew Douglas, Jung Choi, Mary Ann ClarkPublisher:OpenStax
 Biology Today and Tomorrow without Physiology (Mi...BiologyISBN:9781305117396Author:Cecie Starr, Christine Evers, Lisa StarrPublisher:Cengage Learning
 Concepts of BiologyBiologyISBN:9781938168116Author:Samantha Fowler, Rebecca Roush, James WisePublisher:OpenStax College
 Human Biology (MindTap Course List)BiologyISBN:9781305112100Author:Cecie Starr, Beverly McMillanPublisher:Cengage Learning


