
(a):
Cumulative distribution of income.
(a):
Explanation of Solution
The economic development is achieved when the economic price increases per head of the population in the economy. The unequal distribution of the economic price between the people in the economy causes the income inequality in the economy. The income inequality is the situation in the economy in which the major part of the income will be earned by a smaller proportion of the population and vice versa.
The cumulative share of income can be easily calculated by adding the share of income with each preceding level's cumulative share of income. Here, in this case, the percentage share of income for A for the lowest fifth is 17.7 percent. Since there are no preceding levels, the cumulative share would remain the same as 17.7 percent. The percentage share of income for the second lowest fifth is 19.9 percent. Thus, the cumulative share of the second lowest fifth will be summation of the percentage share of both lowest fifth and second lowest fifth, which can be calculated as follows:
Thus, the cumulative share of income for the second lowest fifth is calculated to be 37.6 percent. Similarly, the cumulative share of income can be calculated, and the table can be completed as follows:
| A | B | |||
| Percentage of families | Percentage share | Cumulative share | Percentage share | Cumulative share |
| Lowest fifth | 17.7% | 17.7% | 9.0% | 9.0% |
| Second lowest fifth | 19.9 | 37.6 | 14.2 | 23.2 |
| Middle fifth | 20.4 | 58.0 | 17.5 | 40.7 |
| Second highest fifth | 20.7 | 78.7 | 21.9 | 62.6 |
| Highest fifth | 21.3 | 100.0 | 37.4 | 100.0 |
Income Inequality: The income inequality is the situation where most of the
(b):
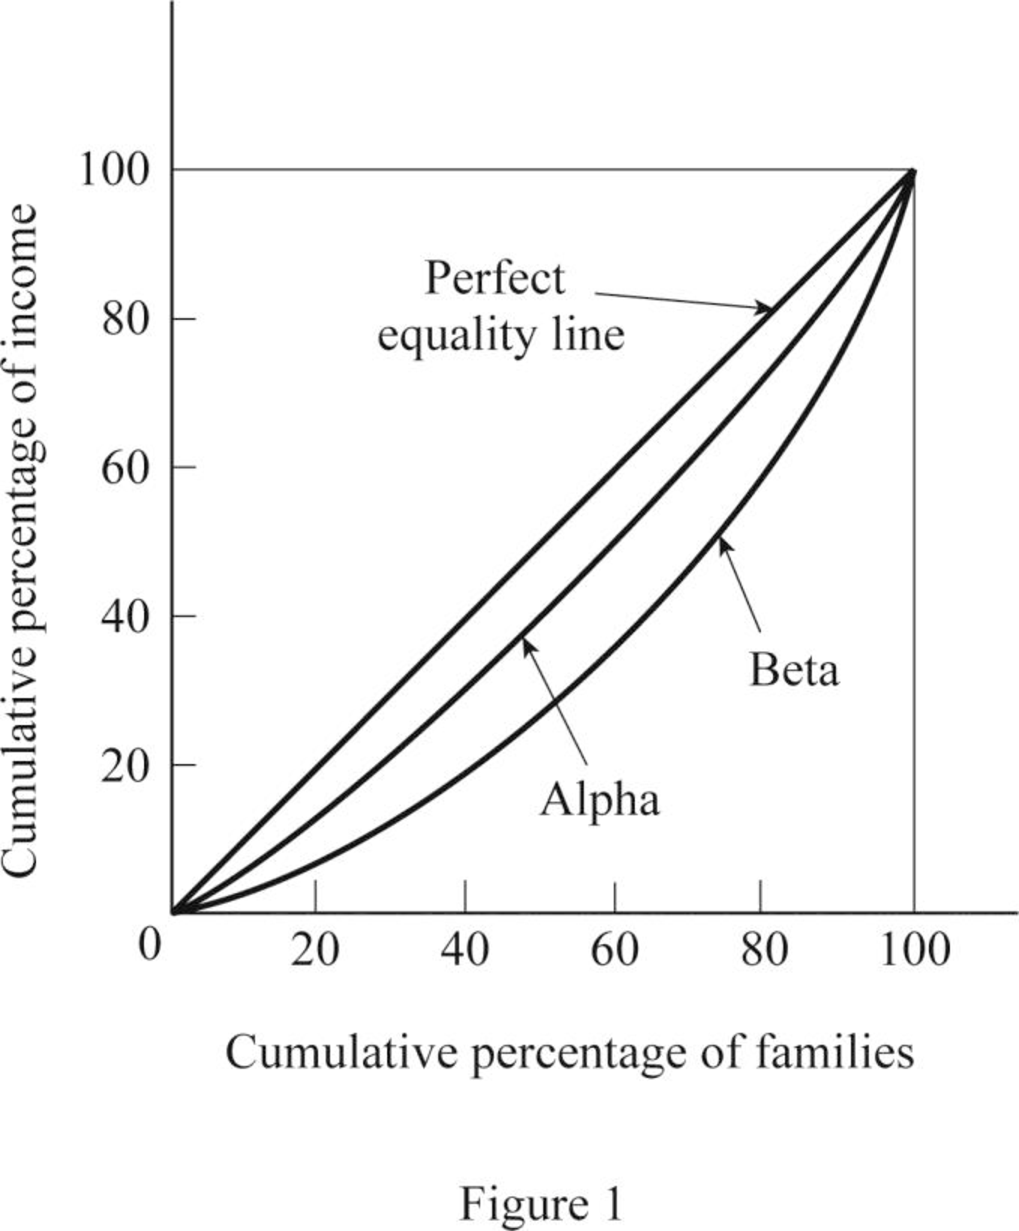
Lorenz curve of the economy.
(b):
Explanation of Solution
The Lorenz curve is the graphical illustration of the distribution of wealth in the economy. It is drawn on the cumulative percentage of income against the cumulative percentage of the population. Thus, it shows the cumulative shares of income received by the family. Thus, based on the table above, the Lorenz curve can be constructed as follows:
(c):
Country with more equal distribution of income.
(c):
Explanation of Solution
From the Lorenz curve diagram, it can be identified that the line that lies more close to the line of equality has more equal distribution of income. From the diagram, it is identified that Lorenz curve of Country A is closest to the line of equality and thus, Country A has more equal income distribution.
Want to see more full solutions like this?
Chapter 12 Solutions
Micro Economics For Today

- A hospital charges $200 for a medical procedure, and 1,000 patients use the service. The hospital raises the price to $250, and the number of patients drops to 900. Calculate the price elasticity of demand (PED) and explain your answer. (show all working) Briefly explain how elasticity affects government health policies in the following cases: • Taxes on unhealthy products (cigarettes, alcohol, sugary drinks) • Subsidizing Preventive Care (e.g., vaccines, screenings) Drug Price Controls & Generic Substitutions Co-Payments & Insurance Designarrow_forwardAssume the United States is a large consumer of steel, able to influence the world price. DUS and SUS denote its demand and supply schedules in Figure 1. The overall (United States plus world) supply schedule of steel is denoted by SUS.+W. Figure 1 Import Tariff Levied by a Large Country Answer all questions (a-f) by referring to Figure 1 above. a) Calculate the free trade market equilibrium price, domestic consumption, and volumE Answer all questions (a-f) by referring to Figure 1 above. a) Calculate the free trade market equilibrium price, domestic consumption, and volume of steel imports by the US. [5 marks] b) Suppose the United States imposes a tariff (t) of $100 on each ton of steel imported. With the tariff, calculate the price of steel and the volume of steel imports by the US. [5 marks] c) Of the $100 tariff, how much is passed on to the US consumer via a higher price, and how much is borne by the foreign exporter? [5 marks] d) Calculate the tariff's deadweight welfare loss to…arrow_forward1. A doctor quits his job, which pays $77,000 per annum, to open a non-governmental organization (NGO) to serve the needs of orphans. His annual expenses for the NGO amounts to $62,700 for food and daily supplies, $9,400 for maintenance, and $1,800 for books. What is his opportunity cost of opening the NGO? (Show working) 2. During the COVID-19 pandemic, hospitals worldwide faced severe resource constraints, including: a. Limited ICU beds b. Shortage of ventilators c. Insufficient doctors and nurses d. Lack of vaccines in early 2021 Governments and hospitals had to make critical decisions about who receives treatment first and how to allocate limited resources efficiently. In no more than 150 words and using core economic concepts of scarcity, choice and opportunity cost, how would you help your government make these critical decisions?arrow_forward
- What is the argument about necessary evil?arrow_forwardWhat are the consequences of declining houses prices?arrow_forwardQ1 Explain what economic catch 22 is. Q2 What are the consequences of declining houses pricing? Q3 What is the argument about necessary evil? Q4 Explain the idea of irrational exhuberance? Q5 Explain what was the economic paradox?arrow_forward
- < Files 9:10 Fri Mar 21 Chapter+11-Public+Goods+and+Common+Res... The Economic Catch-22 By Robert J. Samuelson We are now in the "blame phase" of the economic cycle. As the housing slump deepens and financial markets swing erratically, we've embarked on the usual search for culprits. Who got us into this mess? Our investigations will doubtlessly reveal, as they already have, much wishful thinking and miscalculation. They will also find incompetence, predatory behavior and probably some criminality. But let me suggest that, though inevitable and necessary, this exercise is also simplistic and deceptive. -- business It assumes that, absent mistakes and misdeeds, we might remain in a permanent paradise of powerful income and wealth growth. The reality, I think, is that the economy follows its own Catch-22: By taking prosperity for granted, people perversely subvert prosperity. The more we managers, investors, consumers - think that economic growth is guaranteed and that risk and…arrow_forward2.) Using the line drawing tool, plot and label the isocost line. Carefully follow the instructions above, and only draw the required objects. FILL IN BLANK d. Now suppose the price of labour rises to $5 per unit, but the firm still wants to produce 500 tires per day. Explain how a cost-minimizing firm adjusts to this change (with no change in technology). A cost-minimizing firm will be producing on ▼ The samedifferently slopedparallel isocost line. The firm will use ▼ moresameless labour and ▼ less the same amount of more capital and produce on ▼ a higher point on the same a lower point on the same a lower a higher isoquant curve.arrow_forwardQK Using the graph on the right, determine how the firm should change the quantity of the production factors in order to reduce the costs. The firm that is producing at point A can reduce its costs for producing 2000 units by employing A. same capital and more labour. B. less capital and more labour. ○ C. less capital and the same labour. D. more capital and more labour. OE. more capital and less labour. C A B Q =4000 Q = 2000 C Isocost line QLarrow_forward
- PL Suppose the price ratio is the same along isocost PK lines A and B. In the figure at right, the difference between isocost line A and isocost line B is that A. the total cost is larger along B. B. the total cost is larger along A. OC. labour is relatively more expensive along A. ○ D. the level of output is lower along A. OE. both capital and labour are relatively cheaper along A. Capital B Labourarrow_forwardUsing the graph on the right, determine the per unit prices of capital and labour. 20- Given the information provided about the isocost lines, we know that the per unit price of capital is TC=$100 and the per unit price of labour is 16- TC $80 ○ A. $50; $20 ○ B. $2; $5 ○ C. $5; $2 ○ D. $20; $50 E. not determinable; not determinable Quantity of K 12 TC $60 TC $40 0 10 20 30 Quantity of L 40arrow_forwardThe diagram to the right contains isocost lines A and B. If the price of capital is the same for both lines, then the difference between isocost line A and isocost line B is that OA. the total cost is larger along B. B. the level of output is lower along A. C. both capital and labour are cheaper along A. OD. labour is more expensive along A. ○ E. labour is more expensive along B. Capital Labourarrow_forward


 Economics (MindTap Course List)EconomicsISBN:9781337617383Author:Roger A. ArnoldPublisher:Cengage Learning
 Principles of Economics 2eEconomicsISBN:9781947172364Author:Steven A. Greenlaw; David ShapiroPublisher:OpenStax
 Microeconomics: Private and Public Choice (MindTa...EconomicsISBN:9781305506893Author:James D. Gwartney, Richard L. Stroup, Russell S. Sobel, David A. MacphersonPublisher:Cengage Learning