
Concept explainers
Videos
In addition to the key words, you should also be able to define each of the following terms:
Linear relationship
Pearson
Monotonic relationship
Spearman correlation
Statistical significance of a
Regression
Third-variable problem
Directionality problem
Multiple regression
To define:
Each of the following terms: Scatter plot, linear relationships, Pearson correlation, monotonic relationship, Spearman correlation, Statistical significance of a correlation, regression, third variable problem, directionality problem, multiple regressions.
Explanation of Solution
Explanations:
Scatter Plot: It is a 2D graph between 2 variables X and Y obtained by plotting X on horizontal and Y on vertical axes. The scatter plot is mainly done to study the extent of correlation between 2 variables. If a large correlation exists then the points scatter in a line and if there's no such correlation then they are scattered randomly.
Linear Relationship: In a linear relationship the relationship between 2 variables can be represented with a line. The linear relationship can be positive or negative depending on the fact that if X increase then Y increases too and it is positive. It is negative when X increases but Y decreases. Linear relationships can be determined using scatter plots between 2 variables. There ca be no relationship too in that case the points scattered randomly. Graphical representation of positive linear relation: 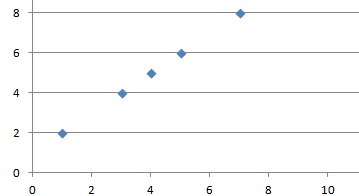
Pearson correlation:
Pearson product correlation coefficient is a measure of linear association between 2 variables X and Y. It has a value between -1 and +1 and is denoted by r.
r consists of a ratio comparing the covariance( X and Y) (numerator) with the variance of X and Y separately (in the denominator).
The formula:
Monotonic relationship: It is the degree to which the relationship is one directional. So as one value increases the other also increases and as one decreases other also decreases. Spearman correlation measures this value.
Spearman Correlation: This is distribution free alternative to Pearson r value. It measures strength and direction of monotonic relationship and used mostly for ordinal observations.
The formula is:
In this case ranks are calculated for each data X and Y and their difference is taken represented as d in the formula. It can also take values in (-1,+1)range. A high positive value like 0.9 indicates a strong positive correlation and vice versa. So here as X increases so does Y (Just like r).
Statistical Significance of a correlation: Correlation is tested using t statistic.
The formula is provided as
to test whether the linear relationship is strong enough to model the relationship in the population. The hypothesis tests decide if the population correlation
Regression: It is a set of statistical processes for establishing or estimating the relationship among variables. Regression analysis helps to understand how changes in independent variable results in changes in dependent variable. It is widely used for prediction and forecasting. It helps in understanding which independent variables are related to the dependent variable and what is the form of the relationship. In other words it can be used to establish causal relationship.
Third variable problem: In context of experimental design third variable can be confounded variable resulting in relationship between 2 variables. Example can be cities with higher churches have higher crime rate but more churches do not lead to more crime so a 3rd variable population lead to more churches and more crime.
Directionality problem: It's a problem with 2 variables when the cause and effect is not known. It's known that there exists a relationship between X and Y however whether X is due to Y or vice versa is not known. For that apart from correlational study experimental study are required to be conducted. So an example can be there's a strong correlation between amount of violence seen on Tv and amount of aggressive behavior by children but its not known whether amount of violence seen on TV is due to aggressive behavior or vice versa.
Multiple regressions: The general purpose of the multiple regressions is to establish a relationship between several predictor variables and a dependent variable. Notation ally if Y is a dependent variable and Xs are several predictors then f is a function or line of least square which is estimated in multiple regressions.
It is widely used in social and natural sciences. Educators might be interested in predictors for success in high school or psychologist might be interested in personality best predicting social adjustments.
For example Price of the house sold can be dependent variable and size of house, number of bedrooms, locality, average income in respective neighborhoods, and appeal of the house can be predictors. The other example can be Salary being dependent and amount of responsibility, number of people to supervise etc. are independent.
Want to see more full solutions like this?
Chapter 12 Solutions
EBK RESEARCH METHODS FOR THE BEHAVIORAL


- Suppose a random sample of 459 married couples found that 307 had two or more personality preferences in common. In another random sample of 471 married couples, it was found that only 31 had no preferences in common. Let p1 be the population proportion of all married couples who have two or more personality preferences in common. Let p2 be the population proportion of all married couples who have no personality preferences in common. Find a95% confidence interval for . Round your answer to three decimal places.arrow_forwardA history teacher interviewed a random sample of 80 students about their preferences in learning activities outside of school and whether they are considering watching a historical movie at the cinema. 69 answered that they would like to go to the cinema. Let p represent the proportion of students who want to watch a historical movie. Determine the maximal margin of error. Use α = 0.05. Round your answer to three decimal places. arrow_forwardA random sample of medical files is used to estimate the proportion p of all people who have blood type B. If you have no preliminary estimate for p, how many medical files should you include in a random sample in order to be 99% sure that the point estimate will be within a distance of 0.07 from p? Round your answer to the next higher whole number.arrow_forward
- A clinical study is designed to assess the average length of hospital stay of patients who underwent surgery. A preliminary study of a random sample of 70 surgery patients’ records showed that the standard deviation of the lengths of stay of all surgery patients is 7.5 days. How large should a sample to estimate the desired mean to within 1 day at 95% confidence? Round your answer to the whole number.arrow_forwardA clinical study is designed to assess the average length of hospital stay of patients who underwent surgery. A preliminary study of a random sample of 70 surgery patients’ records showed that the standard deviation of the lengths of stay of all surgery patients is 7.5 days. How large should a sample to estimate the desired mean to within 1 day at 95% confidence? Round your answer to the whole number.arrow_forwardIn the experiment a sample of subjects is drawn of people who have an elbow surgery. Each of the people included in the sample was interviewed about their health status and measurements were taken before and after surgery. Are the measurements before and after the operation independent or dependent samples?arrow_forward
- iid 1. The CLT provides an approximate sampling distribution for the arithmetic average Ỹ of a random sample Y₁, . . ., Yn f(y). The parameters of the approximate sampling distribution depend on the mean and variance of the underlying random variables (i.e., the population mean and variance). The approximation can be written to emphasize this, using the expec- tation and variance of one of the random variables in the sample instead of the parameters μ, 02: YNEY, · (1 (EY,, varyi n For the following population distributions f, write the approximate distribution of the sample mean. (a) Exponential with rate ẞ: f(y) = ß exp{−ßy} 1 (b) Chi-square with degrees of freedom: f(y) = ( 4 ) 2 y = exp { — ½/ } г( (c) Poisson with rate λ: P(Y = y) = exp(-\} > y! y²arrow_forward2. Let Y₁,……., Y be a random sample with common mean μ and common variance σ². Use the CLT to write an expression approximating the CDF P(Ỹ ≤ x) in terms of µ, σ² and n, and the standard normal CDF Fz(·).arrow_forwardmatharrow_forward
- Compute the median of the following data. 32, 41, 36, 42, 29, 30, 40, 22, 25, 37arrow_forwardTask Description: Read the following case study and answer the questions that follow. Ella is a 9-year-old third-grade student in an inclusive classroom. She has been diagnosed with Emotional and Behavioural Disorder (EBD). She has been struggling academically and socially due to challenges related to self-regulation, impulsivity, and emotional outbursts. Ella's behaviour includes frequent tantrums, defiance toward authority figures, and difficulty forming positive relationships with peers. Despite her challenges, Ella shows an interest in art and creative activities and demonstrates strong verbal skills when calm. Describe 2 strategies that could be implemented that could help Ella regulate her emotions in class (4 marks) Explain 2 strategies that could improve Ella’s social skills (4 marks) Identify 2 accommodations that could be implemented to support Ella academic progress and provide a rationale for your recommendation.(6 marks) Provide a detailed explanation of 2 ways…arrow_forwardQuestion 2: When John started his first job, his first end-of-year salary was $82,500. In the following years, he received salary raises as shown in the following table. Fill the Table: Fill the following table showing his end-of-year salary for each year. I have already provided the end-of-year salaries for the first three years. Calculate the end-of-year salaries for the remaining years using Excel. (If you Excel answer for the top 3 cells is not the same as the one in the following table, your formula / approach is incorrect) (2 points) Geometric Mean of Salary Raises: Calculate the geometric mean of the salary raises using the percentage figures provided in the second column named “% Raise”. (The geometric mean for this calculation should be nearly identical to the arithmetic mean. If your answer deviates significantly from the mean, it's likely incorrect. 2 points) Starting salary % Raise Raise Salary after raise 75000 10% 7500 82500 82500 4% 3300…arrow_forward
 Glencoe Algebra 1, Student Edition, 9780079039897...AlgebraISBN:9780079039897Author:CarterPublisher:McGraw Hill
 Big Ideas Math A Bridge To Success Algebra 1: Stu...AlgebraISBN:9781680331141Author:HOUGHTON MIFFLIN HARCOURTPublisher:Houghton Mifflin Harcourt
 College AlgebraAlgebraISBN:9781305115545Author:James Stewart, Lothar Redlin, Saleem WatsonPublisher:Cengage Learning
 Algebra and Trigonometry (MindTap Course List)AlgebraISBN:9781305071742Author:James Stewart, Lothar Redlin, Saleem WatsonPublisher:Cengage Learning
 Holt Mcdougal Larson Pre-algebra: Student Edition...AlgebraISBN:9780547587776Author:HOLT MCDOUGALPublisher:HOLT MCDOUGAL
 Functions and Change: A Modeling Approach to Coll...AlgebraISBN:9781337111348Author:Bruce Crauder, Benny Evans, Alan NoellPublisher:Cengage Learning