
Videos
CASE STUDY Feeling Lucky? Well, Are You?
In fiscal year (FY) 2013–2014 (July 2013–June 2014), the Florida Lottery generated $5.37 billion in total sales. Over that period, the state spent $37.5 million on advertising to promote its various games. Rand Advertising is interested in gaining access to this lucrative market. You are assigned the task of preparing a report on the lottery sales structure for three of Florida’s online (nonscratch-off ticket) games: Fantasy 5, Lucky Money, and Lotto. Your findings will become part of a proposal by Rand to the Florida Lottery.
In Fantasy 5, a player picks five numbers from 1 to 36, at $1 per play. Drawings are held seven days a week. If there is no jackpot winner for a drawing, the money allocated for the top prize rolls down to the next prize tier (4 of 5).
The Lucky Money game costs $1 per ticket. Players pick four numbers from 1 to 47 and one Lucky Money number from 1 to 22. Drawings are held on Tuesdays and Fridays. If there is no jackpot winner for a drawing, the money allocated for the top prize rolls over to the next drawing, adding to the total of the next jackpot. The prize structures for both games is as shown.
| Prize Structure for Florida’s Fantasy 5 Game | ||
| Match | Estimated Prize Amount per Winner | Probability |
| 5 of 5 | $200,000 |
|
| 4 of 5 | $100 |
|
| 3 of 5 | $10 |
|
| 2 of 5 | Free ticket |
|
| Prize Structure for Florida’s Lucky Money Game | ||
| Match | Estimated Prize Amount per Winner | Probability |
| 4 of 4 + Lucky Ball | $500,000 |
|
| 4 of 4 | $1044 |
|
| 3 of 4 + Lucky Ball | $292 |
|
| 3 of 4 | $71.50 |
|
| 2 of 4 + Lucky Ball | $20 |
|
| 1 of 4 + Lucky Ball | $2.50 |
|
| 2 of 4 | $2 |
|
| 0 of 4 + Lucky Ball | Free ticket |
|
In Lotto, players pick six numbers from 1 to 53, at $1 per play. Drawings are held on Wednesdays and Saturdays. If there is no jackpot winner, the top prize is rolled over to the next drawing. It is difficult to win the Lotto jackpot, so there are numerous jackpot rollovers. Rollovers make it difficult to determine an estimated prize payout per winner. However, the odds structure is shown in the table below.
| Match | Probability |
| 6 of 6 |
|
| 5 of 6 |
|
| 4 of 6 |
|
| 3 of 6 |
|
To conduct your study, you have obtained the sales figures for each of the three games by district sales office for one week. These data are as follows:
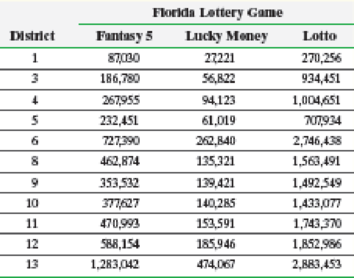
Are the numbers of tickets sold for each lottery game and sales district independent? Construct a bar graph that represents the conditional distribution of game by sales district. Does this graphical evidence support your conclusion regarding the relationship between the type of game and the sales district? Explain.
Additionally, you are interested in the daily sales structure for the various districts. The table on the following page represent the numbers of tickets sold each day for a randomly selected week for the three games in District 1.
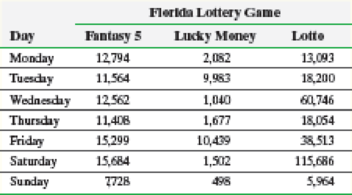
Does the evidence suggest that the proportion of Fantasy 5 sales is the same for each day of the week? Perform a similar test for Lucky Money and Lotto.
Write a report detailing your assumptions, analyses, findings, and conclusions.
Want to see the full answer?
Check out a sample textbook solution
Chapter 12 Solutions
EP FUNDAMENTALS OF STAT.-MYLAB STAT.ACC


- 2PM Tue Mar 4 7 Dashboard Calendar To Do Notifications Inbox File Details a 25/SP-CIT-105-02 Statics for Technicians Q-7 Determine the resultant of the load system shown. Locate where the resultant intersects grade with respect to point A at the base of the structure. 40 N/m 2 m 1.5 m 50 N 100 N/m Fig.- Problem-7 4 m Gradearrow_forwardNsjsjsjarrow_forwardA smallish urn contains 16 small plastic bunnies - 9 of which are pink and 7 of which are white. 10 bunnies are drawn from the urn at random with replacement, and X is the number of pink bunnies that are drawn. (a) P(X=6)[Select] (b) P(X>7) ≈ [Select]arrow_forward
- A smallish urn contains 25 small plastic bunnies - 7 of which are pink and 18 of which are white. 10 bunnies are drawn from the urn at random with replacement, and X is the number of pink bunnies that are drawn. (a) P(X = 5)=[Select] (b) P(X<6) [Select]arrow_forwardElementary StatisticsBase on the same given data uploaded in module 4, will you conclude that the number of bathroom of houses is a significant factor for house sellprice? I your answer is affirmative, you need to explain how the number of bathroom influences the house price, using a post hoc procedure. (Please treat number of bathrooms as a categorical variable in this analysis)Base on the same given data, conduct an analysis for the variable sellprice to see if sale price is influenced by living area. Summarize your finding including all regular steps (learned in this module) for your method. Also, will you conclude that larger house corresponding to higher price (justify)?Each question need to include a spss or sas output. Instructions: You have to use SAS or SPSS to perform appropriate procedure: ANOVA or Regression based on the project data (provided in the module 4) and research question in the project file. Attach the computer output of all key steps (number) quoted in…arrow_forwardElementary StatsBase on the given data uploaded in module 4, change the variable sale price into two categories: abovethe mean price or not; and change the living area into two categories: above the median living area ornot ( your two group should have close number of houses in each group). Using the resulting variables,will you conclude that larger house corresponding to higher price?Note: Need computer output, Ho and Ha, P and decision. If p is small, you need to explain what type ofdependency (association) we have using an appropriate pair of percentages. Please include how to use the data in SPSS and interpretation of data.arrow_forward
- An environmental research team is studying the daily rainfall (in millimeters) in a region over 100 days. The data is grouped into the following histogram bins: Rainfall Range (mm) Frequency 0-9.9 15 10 19.9 25 20-29.9 30 30-39.9 20 ||40-49.9 10 a) If a random day is selected, what is the probability that the rainfall was at least 20 mm but less than 40 mm? b) Estimate the mean daily rainfall, assuming the rainfall in each bin is uniformly distributed and the midpoint of each bin represents the average rainfall for that range. c) Construct the cumulative frequency distribution and determine the rainfall level below which 75% of the days fall. d) Calculate the estimated variance and standard deviation of the daily rainfall based on the histogram data.arrow_forwardAn electronics company manufactures batches of n circuit boards. Before a batch is approved for shipment, m boards are randomly selected from the batch and tested. The batch is rejected if more than d boards in the sample are found to be faulty. a) A batch actually contains six faulty circuit boards. Find the probability that the batch is rejected when n = 20, m = 5, and d = 1. b) A batch actually contains nine faulty circuit boards. Find the probability that the batch is rejected when n = 30, m = 10, and d = 1.arrow_forwardTwenty-eight applicants interested in working for the Food Stamp program took an examination designed to measure their aptitude for social work. A stem-and-leaf plot of the 28 scores appears below, where the first column is the count per branch, the second column is the stem value, and the remaining digits are the leaves. a) List all the values. Count 1 Stems Leaves 4 6 1 4 6 567 9 3688 026799 9 8 145667788 7 9 1234788 b) Calculate the first quartile (Q1) and the third Quartile (Q3). c) Calculate the interquartile range. d) Construct a boxplot for this data.arrow_forward
- Pam, Rob and Sam get a cake that is one-third chocolate, one-third vanilla, and one-third strawberry as shown below. They wish to fairly divide the cake using the lone chooser method. Pam likes strawberry twice as much as chocolate or vanilla. Rob only likes chocolate. Sam, the chooser, likes vanilla and strawberry twice as much as chocolate. In the first division, Pam cuts the strawberry piece off and lets Rob choose his favorite piece. Based on that, Rob chooses the chocolate and vanilla parts. Note: All cuts made to the cake shown below are vertical.Which is a second division that Rob would make of his share of the cake?arrow_forwardThree players (one divider and two choosers) are going to divide a cake fairly using the lone divider method. The divider cuts the cake into three slices (s1, s2, and s3). If the choosers' declarations are Chooser 1: {s1 , s2} and Chooser 2: {s2 , s3}. Using the lone-divider method, how many different fair divisions of this cake are possible?arrow_forwardTheorem 2.6 (The Minkowski inequality) Let p≥1. Suppose that X and Y are random variables, such that E|X|P <∞ and E|Y P <00. Then X+YpX+Yparrow_forward
 Big Ideas Math A Bridge To Success Algebra 1: Stu...AlgebraISBN:9781680331141Author:HOUGHTON MIFFLIN HARCOURTPublisher:Houghton Mifflin Harcourt
 Holt Mcdougal Larson Pre-algebra: Student Edition...AlgebraISBN:9780547587776Author:HOLT MCDOUGALPublisher:HOLT MCDOUGAL