To determine:
The following three graphs show the level of impurities found in a particular source of drinking water.
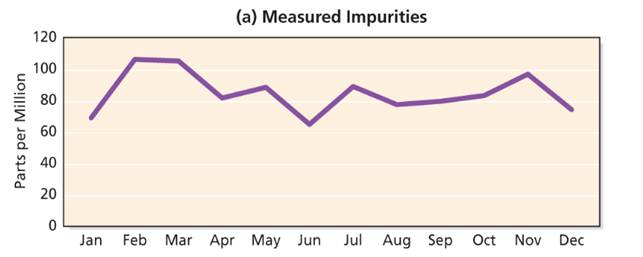
Chart (a) suggests that the source has a consistently high level of impurities throughout the year.
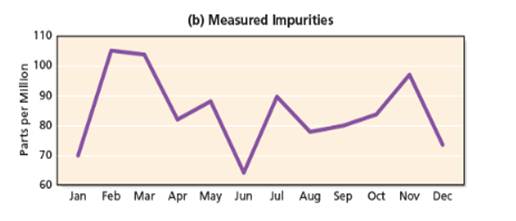
Chart (b) indicates that the level of impurities jumps up and down throughout the year.
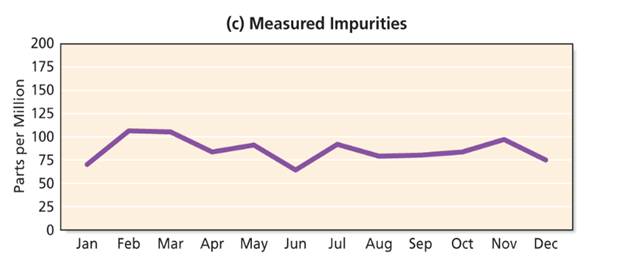
Chart (c) shows an impurity level that is fairly consistent throughout the year—and fairly low.
Introduction: Visuals such as graphs and charts included in a report/ article help to understand the text/ content easily. Those visuals have a strong impact on the readers perception about the information presented. Therefore, it is important to verify the quality of the information presented.
Answer to Problem 1CA
Solution: Visuals are a good way of presenting information. However, visuals can be created in different ways which will give the reader wrong impression. Writers should be careful not to distort information by creating visuals. If the rage is set as 0-500, the graph will show that there are no considerable variations in level of impurities.
Explanation of Solution
Although the visuals are an effective way of presenting information, they can sometimes provide wrong impression to the reader as shown in the above 3 graphs. The above graphs show the same information yet, they provide three different impressions. It is because of the vertical scales used in the graphs. In chart (a), the scale is 0-120 and it shows a fair level of variation of impurities level throughout the year. When consider chart (b), the range is set as 60-110 narrowing the scale compared to chart (a). This chart shows the reader the variation of impurities level is significant and it creates a strong impact on the readers’ impression. The chart (c) has been created by using the same data set, using a wider range 0-200. The graph shows minimum variation of the impurities level throughout year.
If the vertical scale is set to 0-500 spreading the range further compared to chart (c) above, it will further minimize the range of variation of impurities level and the reader would perceive that there is no an impact of impurities level throughout the year.
In this way, using the same data, visuals can be created to give different impressions. Therefore, writers’ task is to give the correct impression by considering the information need of the target audience.
Want to see more full solutions like this?
Chapter 12 Solutions
Excellence in Business Communication (11th Edition)

- Please explain the solution to this general accounting problem using the correct accounting principles.arrow_forwardCan you explain the correct approach to solve this general accounting question?arrow_forwardCan you solve this financial accounting problem using accurate calculation methods?arrow_forward
- Can you help me find the accurate solution to this financial accounting problem using valid principles?arrow_forwardI am searching for the accurate solution to this general accounting problem with the right approach.arrow_forwardI am looking for the correct answer to this general accounting problem using valid accounting standards.arrow_forward
 BUSN 11 Introduction to Business Student EditionBusinessISBN:9781337407137Author:KellyPublisher:Cengage Learning
 Essentials of Business Communication (MindTap Cou...BusinessISBN:9781337386494Author:Mary Ellen Guffey, Dana LoewyPublisher:Cengage Learning
 Accounting Information Systems (14th Edition)BusinessISBN:9780134474021Author:Marshall B. Romney, Paul J. SteinbartPublisher:PEARSON
 International Business: Competing in the Global M...BusinessISBN:9781259929441Author:Charles W. L. Hill Dr, G. Tomas M. HultPublisher:McGraw-Hill Education