
EP BASIC BUS.STATS-ACCESS (18 WEEKS)
14th Edition
ISBN: 9780135989005
Author: BERENSON
Publisher: PEARSON CO
expand_more
expand_more
format_list_bulleted
Concept explainers
Videos
Textbook Question
Chapter 12, Problem 12PS
Use the following
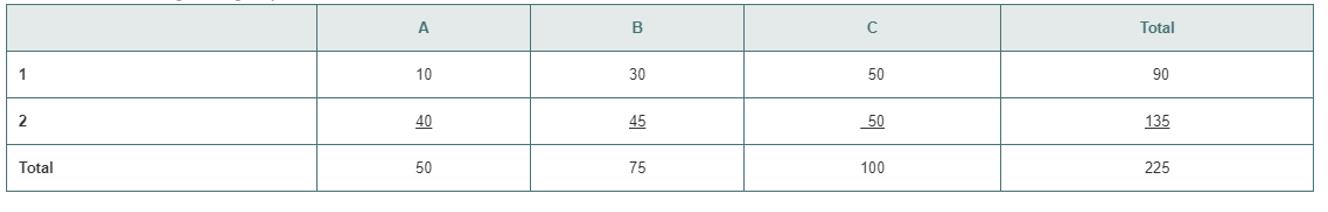
a. Compute the expected frequency for each cell.
b. Compute
Expert Solution & Answer
Want to see the full answer?
Check out a sample textbook solution
Students have asked these similar questions
please find the answers for the yellows boxes using the information and the picture below
A marketing agency wants to determine whether different advertising platforms generate significantly different levels of customer engagement. The agency measures the average number of daily clicks on ads for three platforms: Social Media, Search Engines, and Email Campaigns. The agency collects data on daily clicks for each platform over a 10-day period and wants to test whether there is a statistically significant difference in the mean number of daily clicks among these platforms. Conduct ANOVA test.
You can provide your answer by inserting a text box and the answer must include: also please provide a step by on getting the answers in excel
Null hypothesis,
Alternative hypothesis,
Show answer (output table/summary table), and
Conclusion based on the P value.
A company found that the daily sales revenue of its flagship product follows a normal distribution with a mean of $4500 and a standard deviation of $450. The company defines a "high-sales day" that is, any day with sales exceeding $4800. please provide a step by step on how to get the answers
Q: What percentage of days can the company expect to have "high-sales days" or sales greater than $4800?
Q: What is the sales revenue threshold for the bottom 10% of days? (please note that 10% refers to the probability/area under bell curve towards the lower tail of bell curve)
Provide answers in the yellow cells
Chapter 12 Solutions
EP BASIC BUS.STATS-ACCESS (18 WEEKS)
Ch. 12 - Determine the critical value of 2 with 1 degree of...Ch. 12 - Determine the critical value of 2 with 1 degree of...Ch. 12 - Use the following contingency table: a. Compute...Ch. 12 - Use the following contingency table: a. Compare...Ch. 12 - An lpsos poll asked 1,004 adults “If purchasing...Ch. 12 - Prob. 6PSCh. 12 - Prob. 7PSCh. 12 - The Society for Human Resource Management (SHRM)...Ch. 12 - What Social media tools do marketers commonly use?...Ch. 12 - Docs co-browsing have positive effects on the...
Ch. 12 - Consider a contingency table, with two rows and...Ch. 12 - Use the following contingency table: a. Compute...Ch. 12 - Use the following contingency table: a. Compute...Ch. 12 - How common are financial cost or contractual...Ch. 12 - Business sensor technology provides a way for...Ch. 12 - Prob. 16PSCh. 12 - Repeat (a) and (b) of Problem 12.16, assuming that...Ch. 12 - Prob. 18PSCh. 12 - The MSCI 2016 Survey of Women of Boards Survey...Ch. 12 - Prob. 20PSCh. 12 - Prob. 21PSCh. 12 - Prob. 22PSCh. 12 - A Gallup survey across generations of workers...Ch. 12 - How often do Facebook users post? A study by the...Ch. 12 - What makes sales leaders tick? Mercuri...Ch. 12 - PwC takes a closer look at what CEOs are looking...Ch. 12 - Using Table E.6, determine the lower-and...Ch. 12 - Using Table E.6, determine the lower-tail critical...Ch. 12 - Prob. 29PSCh. 12 - Prob. 30PSCh. 12 - Prob. 31PSCh. 12 - Prob. 32PSCh. 12 - From Problem 12.32 , at the 0.05 level of...Ch. 12 - In Problems 12.32 and 12.33, what is your...Ch. 12 - A vice president for marketing recruits 20 college...Ch. 12 - Prob. 36PSCh. 12 - Is there a difference in the satisfaction rating...Ch. 12 - The management of a hotel has the business...Ch. 12 - Prob. 39PSCh. 12 - Brand valuations are critical to CEOs, financial...Ch. 12 - A bank with a branch located in a commercial...Ch. 12 - Prob. 42PSCh. 12 - Prob. 43PSCh. 12 - Prob. 44PSCh. 12 - A pet food company has the business objective of...Ch. 12 - A hospital conducted a study of the waiting time...Ch. 12 - Prob. 47PSCh. 12 - An advertising agency has been hired by a...Ch. 12 - Prob. 49PSCh. 12 - The more costly and time consuming it is to export...Ch. 12 - Prob. 51PSCh. 12 - Prob. 52PSCh. 12 - Prob. 53PSCh. 12 - Prob. 54PSCh. 12 - Prob. 55PSCh. 12 - Prob. 56PSCh. 12 - Prob. 57PSCh. 12 - Prob. 58PSCh. 12 - Prob. 59PS
Knowledge Booster


Learn more about
Need a deep-dive on the concept behind this application? Look no further. Learn more about this topic, statistics and related others by exploring similar questions and additional content below.Similar questions
- Business Discussarrow_forwardThe following data represent total ventilation measured in liters of air per minute per square meter of body area for two independent (and randomly chosen) samples. Analyze these data using the appropriate non-parametric hypothesis testarrow_forwardeach column represents before & after measurements on the same individual. Analyze with the appropriate non-parametric hypothesis test for a paired design.arrow_forward
- Should you be confident in applying your regression equation to estimate the heart rate of a python at 35°C? Why or why not?arrow_forwardGiven your fitted regression line, what would be the residual for snake #5 (10 C)?arrow_forwardCalculate the 95% confidence interval around your estimate of r using Fisher’s z-transformation. In your final answer, make sure to back-transform to the original units.arrow_forward
arrow_back_ios
SEE MORE QUESTIONS
arrow_forward_ios
Recommended textbooks for you
 Glencoe Algebra 1, Student Edition, 9780079039897...AlgebraISBN:9780079039897Author:CarterPublisher:McGraw Hill
 Trigonometry (MindTap Course List)TrigonometryISBN:9781337278461Author:Ron LarsonPublisher:Cengage Learning
 Algebra & Trigonometry with Analytic GeometryAlgebraISBN:9781133382119Author:SwokowskiPublisher:Cengage
Glencoe Algebra 1, Student Edition, 9780079039897...
Algebra
ISBN:9780079039897
Author:Carter
Publisher:McGraw Hill
Trigonometry (MindTap Course List)
Trigonometry
ISBN:9781337278461
Author:Ron Larson
Publisher:Cengage Learning
Algebra & Trigonometry with Analytic Geometry
Algebra
ISBN:9781133382119
Author:Swokowski
Publisher:Cengage
Statistics 4.1 Point Estimators; Author: Dr. Jack L. Jackson II;https://www.youtube.com/watch?v=2MrI0J8XCEE;License: Standard YouTube License, CC-BY
Statistics 101: Point Estimators; Author: Brandon Foltz;https://www.youtube.com/watch?v=4v41z3HwLaM;License: Standard YouTube License, CC-BY
Central limit theorem; Author: 365 Data Science;https://www.youtube.com/watch?v=b5xQmk9veZ4;License: Standard YouTube License, CC-BY
Point Estimate Definition & Example; Author: Prof. Essa;https://www.youtube.com/watch?v=OTVwtvQmSn0;License: Standard Youtube License
Point Estimation; Author: Vamsidhar Ambatipudi;https://www.youtube.com/watch?v=flqhlM2bZWc;License: Standard Youtube License