STAT TECH IN BUSINESS & ECON AC
18th Edition
ISBN: 9781264731657
Author: Lind
Publisher: MCG
expand_more
expand_more
format_list_bulleted
Textbook Question
Chapter 12, Problem 12E
The following are six observations collected from treatment 1, ten observations collected from treatment 2, and eight observations collected from treatment 3. Test the hypothesis that the treatment means are equal at the .05 significance level.
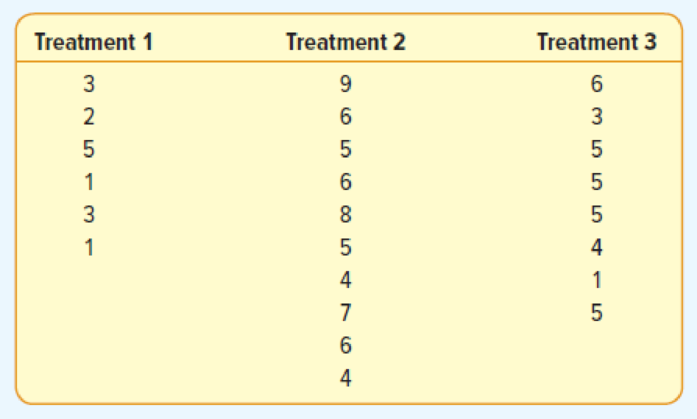
- a. State the null hypothesis and the alternate hypothesis.
- b. What is the decision rule?
- c. Compute SST, SSE, and SS total.
- d. Complete an ANOVA table.
- e. State your decision regarding the null hypothesis.
- f. If H0 is rejected, can we conclude that treatment 2 and treatment 3 differ? Use the 95% level of confidence.
Expert Solution & Answer
Want to see the full answer?
Check out a sample textbook solutionStudents have asked these similar questions
Given the accompanying null hypothesis, alternative hypothesis, and sample information, complete parts a and b below.
Sample 2
n, = 21
Sample 1
n, = 11
HA
s = 1,468
s5 = 1,303
a. If a = 0.01, state the decision rule for the hypothesis.
(Round to two decimal places as needed.)
O A. If the calculated test statistic F=
reject Ho, otherwise do not reject Ho
O B. If the calculated test statistic F, reject Ho, otherwise do not reject Ho-
O C. If the calculated test statistic F>
reject Ho, otherwise do not reject Ho.
O D. If the calculated test statistic F<
reject Ho, otherwise do not reject Ho.
b. Test the hypothesis and indicate whether the null hypothesis should be rejected.
Determine the test statistic.
F= (Round to two decimal places as needed.)
The accompanying table lists body temperatures (in °F) obtained from randomly selected subjects. Using a 0.05
significance level, test for an interaction between gender and smoking, test for an effect from gender, and test for an
effect from smoking. What do you conclude?
Click the icon to view the body temperature data.
First test for an interaction between the two factors. Determine the null and alternative hypotheses. Choose the correct
answer below.
A. Ho: Body temperatures are not affected by gender.
H₁: Body temperatures are affected by gender.
B. Ho: Body temperatures are not affected by an interaction between gender and smoking.
H₁: Body temperatures are affected by an interaction between gender and smoking.
C. Ho: Body temperatures are affected by an interaction between gender and smoking.
H₁: Body temperatures are not affected by an interaction between gender and smoking.
D. Ho: Body temperatures are not affected by smoking.
H₁: Body temperatures are affected by smoking.…
Chantix (varenicline) is a drug used as an aid for those who want to
stop smoking. The adverse reaction of nausea has been studied in
clinical trials, and the table below summarizes results. Use a 0.01
significance level to test the claim that nausea is independent of
whether the subject took a placebo or Chantix.
Placebo
Chantix
Nausea
10
30
No Nausea
795
791
1.What is the conclusion of this study?
2.What is the decision rule of this study?
3. What is the computed Chi-square value?
Chapter 12 Solutions
STAT TECH IN BUSINESS & ECON AC
Ch. 12 - Steele Electric Products Inc. assembles cell...Ch. 12 - What is the critical F value when the sample size...Ch. 12 - Prob. 2ECh. 12 - Prob. 3ECh. 12 - Prob. 4ECh. 12 - Prob. 5ECh. 12 - Prob. 6ECh. 12 - Prob. 2SRCh. 12 - Prob. 7ECh. 12 - Prob. 8E
Ch. 12 - Prob. 9ECh. 12 - Prob. 10ECh. 12 - Prob. 3SRCh. 12 - Prob. 11ECh. 12 - The following are six observations collected from...Ch. 12 - Prob. 13ECh. 12 - Prob. 14ECh. 12 - Prob. 4SRCh. 12 - Prob. 15ECh. 12 - For exercises 15 and 16, conduct a test of...Ch. 12 - Prob. 17ECh. 12 - Prob. 18ECh. 12 - Prob. 5SRCh. 12 - Prob. 19ECh. 12 - Prob. 20ECh. 12 - Prob. 21ECh. 12 - Prob. 22ECh. 12 - Prob. 23CECh. 12 - Prob. 24CECh. 12 - Prob. 25CECh. 12 - Prob. 26CECh. 12 - In an ANOVA table, the MSE is equal to 10. Random...Ch. 12 - Prob. 28CECh. 12 - Prob. 29CECh. 12 - Prob. 30CECh. 12 - Prob. 31CECh. 12 - Prob. 32CECh. 12 - Prob. 33CECh. 12 - Prob. 34CECh. 12 - Prob. 35CECh. 12 - Prob. 36CECh. 12 - Prob. 37CECh. 12 - Prob. 38CECh. 12 - Prob. 39CECh. 12 - Prob. 40CECh. 12 - Prob. 41CECh. 12 - Prob. 42CECh. 12 - Prob. 43CECh. 12 - Prob. 44CECh. 12 - Prob. 45CECh. 12 - Prob. 46CECh. 12 - Prob. 47CECh. 12 - Prob. 48CECh. 12 - Prob. 50DACh. 12 - Prob. 51DACh. 12 - Prob. 1PCh. 12 - Prob. 2PCh. 12 - Prob. 3PCh. 12 - Prob. 4PCh. 12 - Prob. 5PCh. 12 - Prob. 6PCh. 12 - Prob. 7PCh. 12 - Prob. 1CCh. 12 - Prob. 2CCh. 12 - Prob. 1.1PTCh. 12 - The likelihood of rejecting a true null hypothesis...Ch. 12 - Prob. 1.3PTCh. 12 - Prob. 1.4PTCh. 12 - Prob. 1.5PTCh. 12 - Prob. 1.6PTCh. 12 - In a two-tailed test, the rejection region is...Ch. 12 - Prob. 1.8PTCh. 12 - Prob. 1.9PTCh. 12 - Prob. 1.10PTCh. 12 - Prob. 2.1PTCh. 12 - Prob. 2.2PTCh. 12 - Prob. 2.3PT
Knowledge Booster
Learn more about
Need a deep-dive on the concept behind this application? Look no further. Learn more about this topic, statistics and related others by exploring similar questions and additional content below.Similar questions
- The following are four observations collected from each of three treatments. Test the hypothesis that the treatment means are equal. Use the 0.05 significance level. Treatment 1 Treatment 2 Treatment 3 8 3 3 6 2 4 10 4 5 9 3 4 State the null and the alternate hypothesis.H0:H1: What is the decision rule? (Round your answer to 2 decimal places.) Do reject or Reject H0 if the test statistic is greater than _________ c&d. Compute SST, SSE, and SS total. (Round your SS, MS and F values to 2 decimal places.) State your decision regarding the null hypothesis. DO NOT REJECT/ REJECTarrow_forwardTest the claim that the proportion of people who own cats is smaller than 90% at the 0.025 significance level.The null and alternative hypothesis would be: A. H0:μ=0.9 Ha:μ<0.9 B. H0:p=0.9 Ha:p>0.9 C. H0:μ=0.9 Ha:μ≠0.9 D. H0:p=0.9 Ha:p≠0.9 E. H0:μ=0.9 Ha:μ>0.9 F. H0:p=0.9 Ha:p<0.9 The standardized test is: two-tailed left-tailed right-tailed Based on a sample of 122 people, 81% owned catsThe test statistic is: (to 2 decimals)The P-value is: (to 4 decimals)Based on this we: Fail to reject the null hypothesis Reject the null hypothesisarrow_forwardDr. Carlton conducts a study to determine the effectiveness of a new intervention for those suffering from eating disorders. He compares patients' weights before the intervention to the same patients' weights after the intervention. What is the appropriate statistical test? a. paired samples t test b. between-subjects, one-way ANOVA. c. independent-samples t test d. Mann–Whitney U testarrow_forward
- Test the claim that the proportion of men who own cats is significantly different than 30% at the 0.01 significance level. The null and alternative hypothesis would be: Ho:p = 0.3 Ho:p = 0.3 Ho:u = 0.3 Ho:µ = 0.3 Ho:p = 0.3 Ho:u = 0.3 H1:p # 0.3 H1:p > 0.3 H1:4 > 0.3 H1:µ < 0.3 H1:p < 0.3 H1:u + 0.3 The test is: left-tailed two-tailed right-tailed Based on a sample of 50 people, 22% owned cats The test statistic is: (to 2 decimals) The positive critical value is: (to 2 decimals) Based on this we: O Fail to reject the null hypothesis Reject the null hypothesisarrow_forwardA random sample of students was studied. Whether the student chose to sit in the front, middle, or back row in a college class was observed, along with the person's GPA. Test the hypothesis that the means are not affected by row using a significance level of 0.05. Assume Normality. Show all four steps, and use a significance level of 0.05. Do not do post-hoc tests. Write the null and alternative hypotheses. Student data Н V or there V between row and GPA V or there V between row and GPA. Front Middle Back Which of the conditions for ANOVA can be assumed to be satisfied based on the given information or can be shown to be satisfied? Select all that apply. 3.057 2.846 2.598 3.891 2.622 2.643 O A. Normality 2.947 3.651 3.073 O B. independent groups 3.582 3.548 3.055 O C. random and independent samples 3.983 2.113 2.481 O D. equal variance 2.702 3.085 2.609 3.531 2.926 2.866 The test statistic is 3.329 3.077 2.926 (Round to two decimal places as needed.) 3.888 2.653 3.203 3.577 2.525 2.635…arrow_forwardTest the claim that the proportion of people who own cats is significantly different than 80% at the 0.02 significance level. The null and alternative hypothesis would be: Ho:µ 0.8 Ho:p= 0.8 Ho:µ = 0.8 Ho:p > 0.8 H1:µ > 0.8 H1:p > 0.8 H1:µ < 0.8 H1:p 0.8 H1:µ + 0.8 H1:p < 0.8 The test is: two-tailed right-tailed left-tailed Based on a sample of 100 people, 84% owned cats (to 2 decimals) The p-value is: Based on this we: Fail to reject the null hypothesis Reject the null hypothesisarrow_forward
- Find the p-value that corresponds to the given standard score, and determine whether to reject the null hypothesis at the 0.10 significance level. Is the alternative hypothesis supported? Z= 0.9 for H0: u=136 pounds and Ha: u is not = 136 pounds. The p-value is ?arrow_forwardA nutrition expert claims that the average American is overweight. To test his claim, a random sample of 29 Americans was selected, and the difference between each person's actual weight and idea weight was calculated. For this data, we have x = 15.7 and s = 29.9. Is there sufficient evidence to conclude that the expert's claim is true? Carry out a hypothesis test at a 9% significance level. Hint: Pay attention to the variable being measured: the difference between actual weight and ideal. A positive value indicates that the person is overweight. %3D A. The value of the standardized test statistic (give to 3 decimal places): B. The p-value is (give to 4 decimal places): C. Your decision for the hypothesis test: O A. Reject Ho. O B. Do Not Reject Ho. C. Do Not Reject Ha. O D. Reject Ha.arrow_forwardTourism is extremely important to the economy of Florida. Hotel occupancy is an often-reported measure of visitor volume and visitor activity (Orlando Sentinel, May 19, 2018). Hotel occupancy data for February in two consecutive years are as follows. Let P1= population proportion of rooms occupied for current year P2= population proportion of rooms occupied for previous year 1,476 1,800 1,343 1,700 a. Formulate the hypothesis test that can be used to determine whether there has been an increase in the proportion of rooms occupied over the one-year period. Current year Ho: P1-P2 - Select your answer - Ha P1 P2 - Select your answer - b. What is the estimated proportion of hotel rooms occupied each year (to 2 decimals)? Previous Year Occupied Rooms Total Rooms * c. Conduct a hypothesis test. What is the p-value (to 4 decimals)? Use Table 1 from Appendix B. p-value = Using a 0.05 level of significance, what is your conclusion? Current Year to Do you think area officials would be pleased…arrow_forward
arrow_back_ios
SEE MORE QUESTIONS
arrow_forward_ios
Recommended textbooks for you
- College Algebra (MindTap Course List)AlgebraISBN:9781305652231Author:R. David Gustafson, Jeff HughesPublisher:Cengage LearningGlencoe Algebra 1, Student Edition, 9780079039897...AlgebraISBN:9780079039897Author:CarterPublisher:McGraw Hill
College Algebra (MindTap Course List)
Algebra
ISBN:9781305652231
Author:R. David Gustafson, Jeff Hughes
Publisher:Cengage Learning
Glencoe Algebra 1, Student Edition, 9780079039897...
Algebra
ISBN:9780079039897
Author:Carter
Publisher:McGraw Hill
Hypothesis Testing using Confidence Interval Approach; Author: BUM2413 Applied Statistics UMP;https://www.youtube.com/watch?v=Hq1l3e9pLyY;License: Standard YouTube License, CC-BY
Hypothesis Testing - Difference of Two Means - Student's -Distribution & Normal Distribution; Author: The Organic Chemistry Tutor;https://www.youtube.com/watch?v=UcZwyzwWU7o;License: Standard Youtube License